
I have two tables where I have to compare rows against columns. First table (excel) contain Analytes as columns, but the second table (sql) has analyte column which contains all the analytes as values. I have to compare the values from the Excel table (which has analytes as columns) with the corresponding limits from second table.

Example of first table:

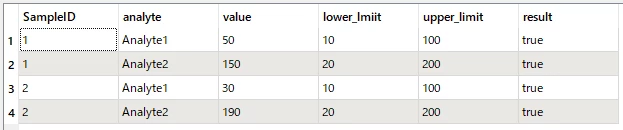
Example of second table:


I have tried couple of methods such as attributepivoter ,doing it via the pythoncaller but was not successful

Hi ​@yusif99 ,

Can you describe specifically what result you would like to get from the two table?


Thanks for your reply. The issue I described should be built as a part of bigger workbench which is aimed at QA/QC of the dataset. Value of each analyte in excel should be compared against relevant value in sql dataset to see whether it is between the lower_limit and upper_limit.


Is this your required resulting table? If not, can you illustrate required result?


Dear Takashi, thanks for the quick response. Yes outcome should be similar to that. The only minor difference is that I will need to create a separate column for each analyte to specify their errors individually and that error columns will be in the excel table not sql: 


  1. Is the number of Analytes two and are the names fixed to "Analyte1" and "Analyte2" always
  2. What values should be written into Error1 and Error2?

The difference between your desired result and the table example I posted previously is not minor. Depending on the answer to the question 1,  the solution could be very complex.


Dear Takashi,


thanks for your reply. Analyte1 and Analyte2 just example names, but in the real table there are around 20 analyte columns. Each Analyte should have related error column and it should state the mistmatch in case values are not matching