
Hi,

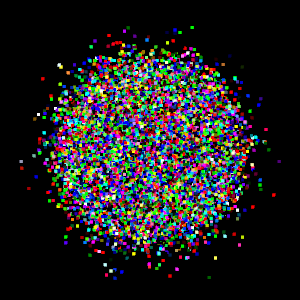
I have a point cloud with colour values. Eg the first image. I would like to make an RGB raster of this at a specified ground size (0.5m2).

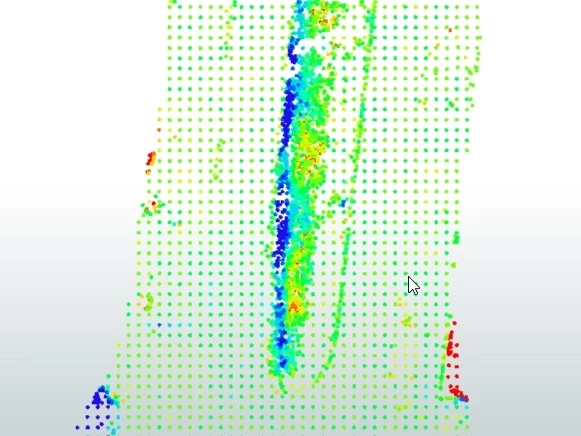
However, whenever I try to do this with the image rasteriser I get nodata pixels everywhere. This is because only about half of my data has a higher density than 0.5m2. Eg the second image.

So what I would like to do is either replace nodata values with an interpolated value (say the nearest colour, or bilinear) or make it correctly in the first place, at my desired size, so that there are no nodata values at all. As in its one continuous raster

Does anyone know how to do this? I haven’t successfully been able to work it out.

I should note that I want the input to be the point cloud as I don’t want to coerce it into points for efficiency. I can definitely do it that way, its just computationally expensive.

I will also say I only have 10 distinct colours (Each representing the height difference between the pointcloud and a DEM). If I could turn spatially distinct groups into 2D areas corresponding to a group I would do that. I really just want to show the difference component in a colour range

Any tips would be great thanks

Hi ​@james_c_452 Can you share a sample of the data? Can you try a courser raster which will generalize a bit but then overlay the finer resolution raster?


Assuming that the colours are simply a colour ramp applied to single numeric values:

  1. Use the values of each point to set the z height (PointCloudExpressionEvaluator)
  2. Use the SurfaceModeller to create a DEMRaster with your chosen output raster resolution

Thanks for your answers ​@crutledge and ​@hkingsbury. I thought of a way similar to what ​@hkingsbury suggested (before I saw his reply). It seems to work when I tested it. I will say it’s not a colour ramp (I couldn’t work out how to set one to the point cloud based on my component so I assigned 10 binned colours in a range)

What I did was split the point cloud into three streams. One where I used the PointCloudExpressionEvaluator to assign the red component to the z component. The other two were the same for the blue and green. Then I used the RasterDEMGenerator to make 3 rasters at the resolution I wanted. I then assigned the colour channel I wanted with the RasterBandInterpretationCoecer and combined them together to make a colour image.

Seems ok for what I need. Though making three seperate rasters is probably memory intensive, but it is better than how I was doing it by coercing into points in my testing. It would be awesome if the colour was a ramp, but that’s a different question


If they’re discrete values for each color, assign them a numeric value in the pointcloud (1-10), then make the dem, then replace each individual cell with the correct rgb values


Hi ​@james_c_452 Can you share a sample of the data? Can you try a courser raster which will generalize a bit but then overlay the finer resolution raster?

I did try to do this, but couldn’t quite work it out. I don’t work with rasters often enough so I’m pretty sure its just my inexperience. Thanks for the thought


Reply