First off, I would recommend against adding a scale factor to your map, from a cartographic point of view. The reasoning is: if you design at a scale of say 1:100000 and somebody prints it at a smaller page size and scales to fit it's not 1:100000 anymore (that happens, even in professional print shops, I could tell you some horror stories...) If it's intended to be viewed on-screen it's even more of a gamble. So a scale bar is a better solution.
Having said that...
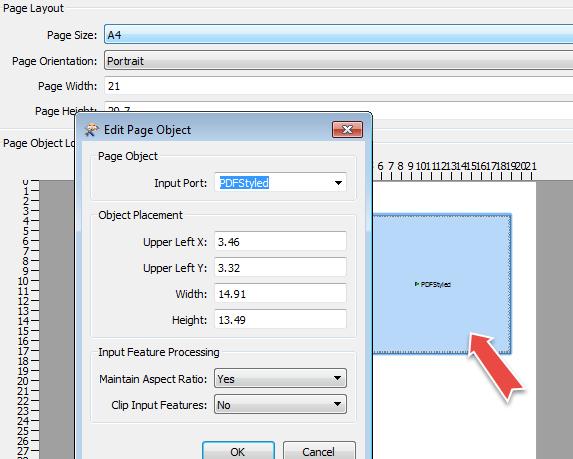
If the width/height of your source data polygon are known you can use a BoundingBoxAccumulator and BoundsExtractor to get the extents of your data, then calculate the scale in x and y direction (xmax-xmin)/width and (ymax-ymin)/height, making sure they're all in the same units. The larger of those two scale values is the one that your data has in the PDF.

However, it's slightly off... In sample I'm using (see attached) my FME calculation ends up with a scale of 1:1322655, if I open the resulting PDF in Adobe Illustrator with the Avenza MAPublisher plug-in it shows a scale of 1:1322490. I'm not sure on which end of the process this is happening.
Probably not the answer you were looking for, but I hope it's helpful anyway. If you have any more questions let me know, I've done a fair bit of work with cartographic PDF output in FME