
I was having a bit of a poke around with how Workbench calls the AI APIs and noticed that the method of sending the workspace was to first convert it to graphviz format.


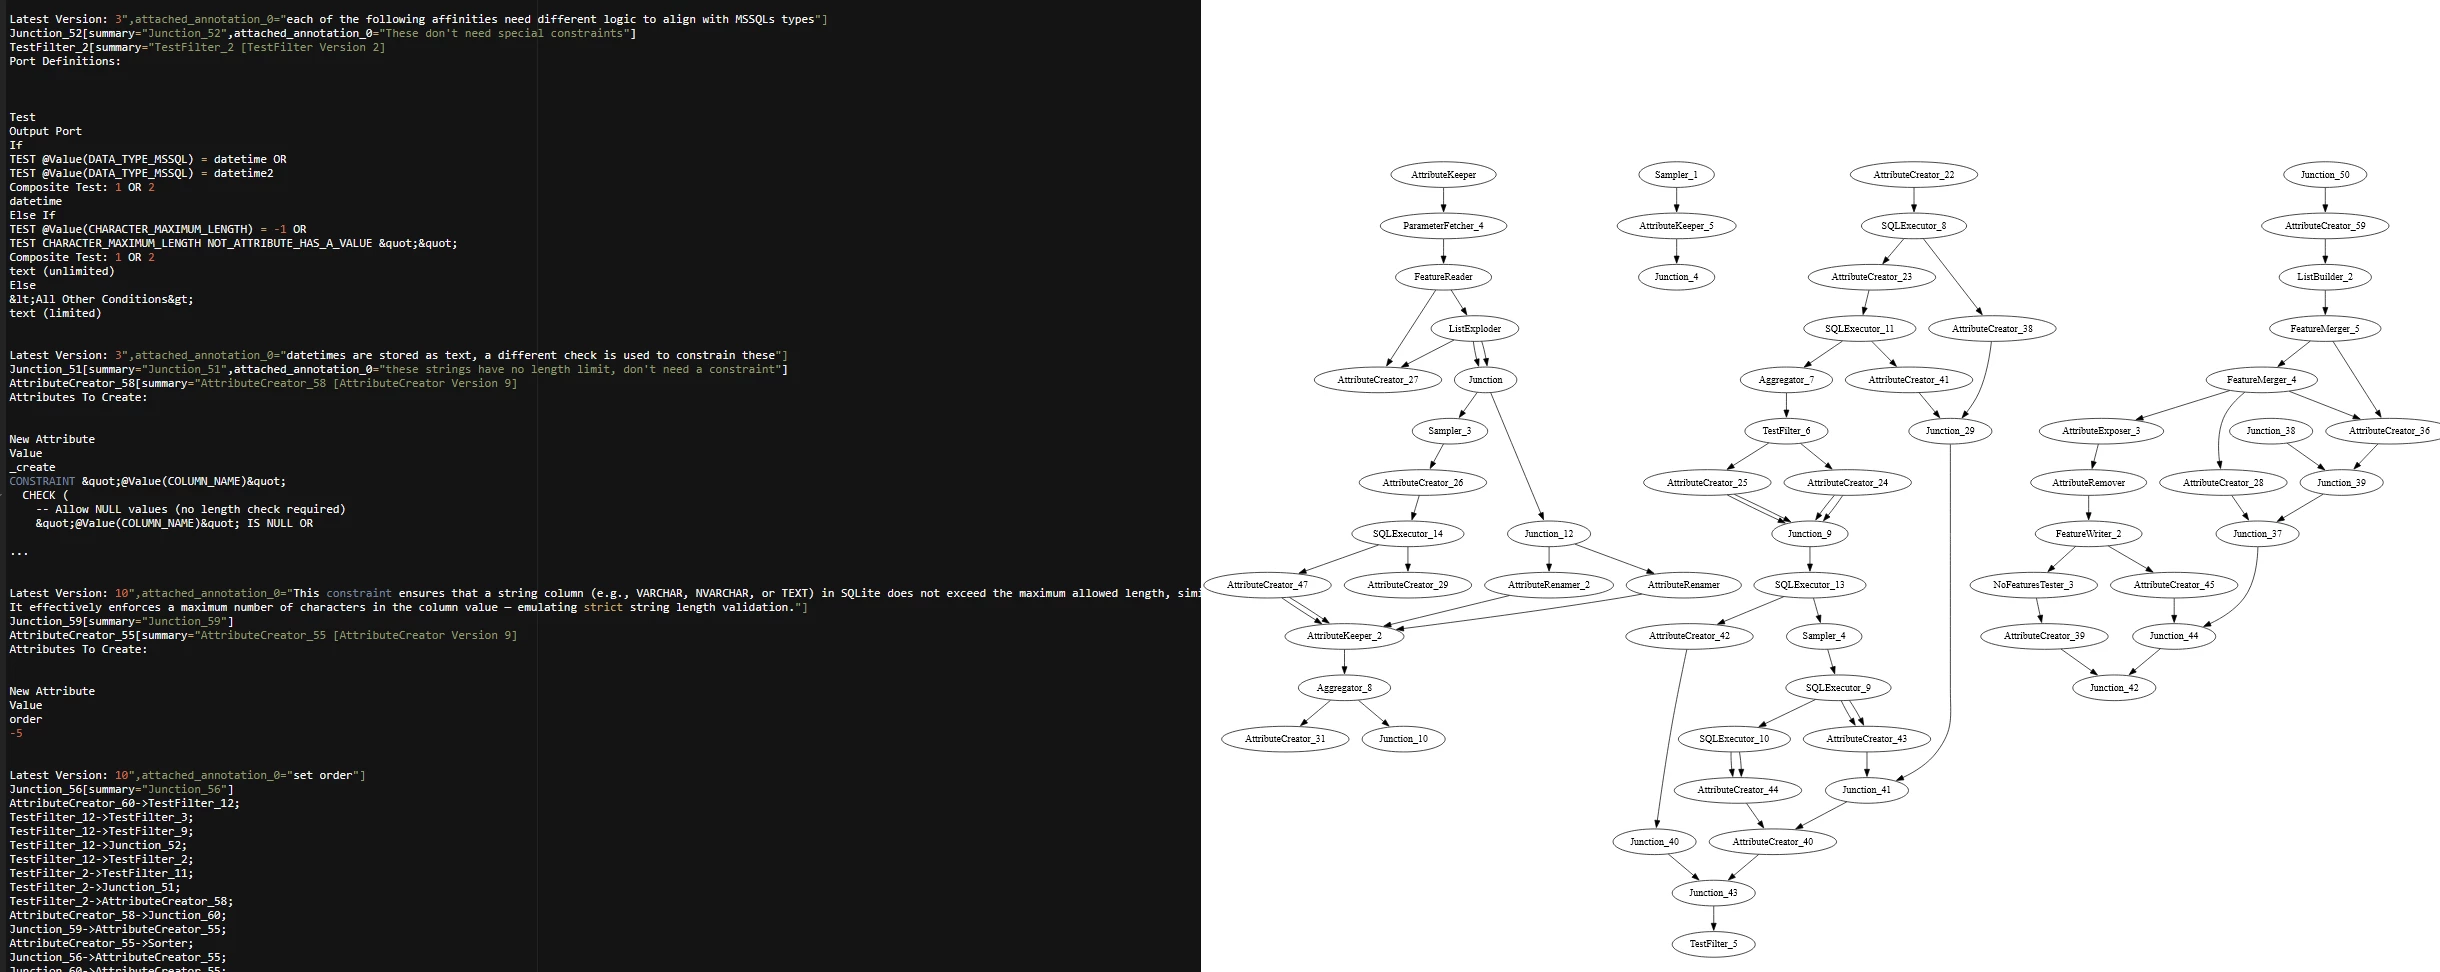
I had initially thought the fmw would’ve been passed and parsed instead,

Converting to graphviz is a pretty cool step and could be used when producing reports or documentation on workspaces. I know people have asked for similar functionalities in the past re exporting the workspace as a graphic:


Is that conversion something that the end user can tap into?


I’m going to shamelessly tag ​@rylanatsafe ​@mark2atsafe and ​@NickAtSafe here, as while they might not be the people directly responsible for answering such a question, I feel like they might be able to point this question in the right direction!

I had a bit of a dig around the Python side hoping to see that the conversion may have been implemented via Python, but that appears to not be the case (as far as my search is concerned). The only graphviz references appear to be internal utilities under matplotlib


So that suggests the conversion is being done deeper! Be cool if that was exposed via the Python API….


@dewetatsafe and ​@JennaKAtSafe shamelessly tagging you two as well!


This is not the area I’m working on, so please take what I say with a grain of salt.

To my knowledge, the generation of the graphviz representation is implemented directly in FME Workbench, and thus may not be as easy to expose in the Python API as FME Engine features.

One major caveat about this representation (that we need to address internally as well) is that it doesn’t include information about which ports are being used. This can of course make a big difference to what the workspace does!

This could also be an XY Problem – if you’re primarily looking for documentation graphics, an SVG of the canvas might be better than a graph format without the same layout data as the workspace itself.

All that being said, I do think this makes sense as a new Idea.


Thanks ​@dewetatsafe!

Based on what you’re saying it’s a very new addition to things! 

I’ve linked this thread to this existing idea: 


Reply