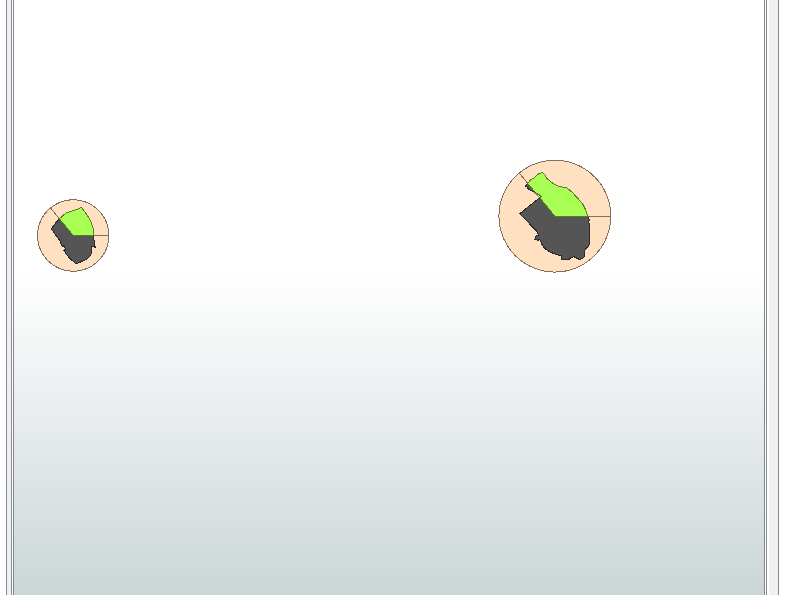
Don't think I'm understanding correctly,but if you want to create a Pie Chart geometry, see the attached Workspace. Simple for pie with two slices, you would want to make it more generic for varying number of slices but you get the idea.
HI,
You might need to include a few more details about what you are wanting to do. Are you wanting a PDF output? Or an image? or still in GIS format? It would be fairly easy to assign a colour to each polygon depending on the attributes.
You could either use an attribute creator using the conditional value to assign a colour value depending on the built and planned area values. Or you could use an attributevaluemapper, either one would work.
As to the colour that would depend on whether you are keeping it as a gis format or outputting as an image or PDF? You can use a colorsetter transformer and feed in the colour from the attribute created in the last step. FME colour is based on RGB values dived by 255, i.e. 0.13,0.48,0.13.
useful site here ;
http://www.tydac.ch/color/
You could use the chartgenerator to create your pie charts but you might have issues in positioning them over your polygons.
Hope that helps.
1. Use a boundingboxaccumulator grouped by district.
2. Use longest side and extract center using snipper at 50%/50%. circel.
3. Expression or attributecreator/manager and create (builtarea/plannedarea) *360.
4.Use (as you are doing only 2 values) two 2DArccreators.
Both with extracted centerpoint using (builtarea/plannedarea) *360 for one and rest 360 - (builtarea/plannedarea) *360 for other. Give each a color of your fancy.
5. Clipp (or areoonare) the circkels with the district shapes.
If you have more thne 2 values you can create a line half the size of the longest side of BB. CLone t by the number of values. Claculate each value and rotate each line.(use the clonenumber to control this) Create a full circkel. Areabuilder on the result. Color each piece( again using the clonenumber)
Clipp with districts.
@gio , I am trying to do it but it didn't work , and the 2DArccreators doesn't exist in the transformer list , I am attaching the shape file , could you tray it in you end districtchart.fmwt
Thanks
@boubcher
sorry..its called 2DArcReplacer
Here is a custom i made to create pies out of any type of input, as long as it has ID, values. Also has groupBy if needed.
You can clip or AoA the resulting pie by, in this case your disrict.
districtchart.fmwt
Haves funs
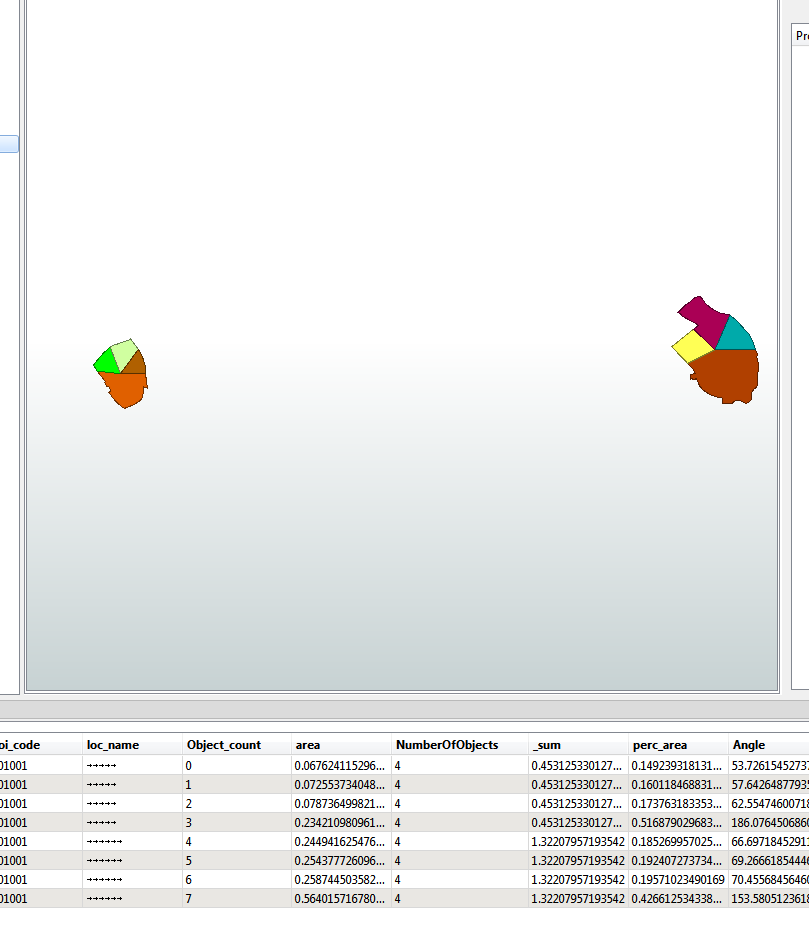
output of pieslicer with sample value of 36 % on your 2 sampledistricts.
You need to adapt it a bit as some of it is dutch...i'll see if i can do that later
@boubcher
I rebuild it to be genereic etc., some anotation added for you as well.
districtchart2.fmwt
Here is sample output where layer_name area is used to create pie.
@gio
Thanks that's exactly what I am looking for, I will explore deeply the work space
Really apreciated
@gio
what is the the function of the custom transfomer PieSlicer and the user parameter are configured to this sample , how could we reuse it in other sample with different attributes?
Thanks