I use FME via windows remote desktop every Monday and Friday and have never noticed any issues.
No experience with it myself, but some anecdotical evidence from clients using Direct Access to connect and reporting similar issues. In their case it seemed to be mostly Workbench (displaying the Quick Add transformers list). How is that behaving when you use it remotely?
I use FME on Remote Desktop connections all the time but I've never had it go unresponsive on me the way you describe it.
However, I can confirm that something weird is going on when selecting the sample feature in the Data Inspector, my CPU usage jumps from about 0-1% to 30-ish% and stays there as long as the feature is selected. When I deselect the feature, the CPU usage goes back to 0-1% again, it's reproducible.
This happens both on my local pc (FME 2017.1) and on the remote desktop instance (FME 2016.1.2) that I tested.
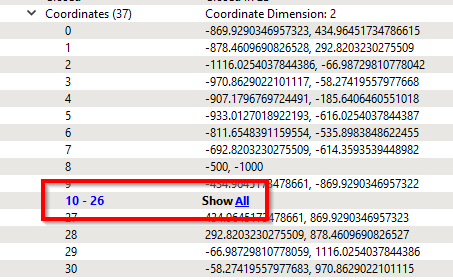
After having looked into it, I think I've isolated the issue, which in fact looks like it's linked to whether the collapsed list of vertices is visible in the feature information window:
If you either add some attributes or make the Inspector window smaller so that the collapsed vertices aren't visible on screen, the CPU usage drops down to about zero. If I click on "Show All" the CPU usage also drops again. This was 100% reproducible on my PC.
Something funky is going on in the source code of that widget, Safe should definitely take a closer look.
No experience with it myself, but some anecdotical evidence from clients using Direct Access to connect and reporting similar issues. In their case it seemed to be mostly Workbench (displaying the Quick Add transformers list). How is that behaving when you use it remotely?
No problems with Workbench remotely whatsoever.
I use FME on Remote Desktop connections all the time but I've never had it go unresponsive on me the way you describe it.
However, I can confirm that something weird is going on when selecting the sample feature in the Data Inspector, my CPU usage jumps from about 0-1% to 30-ish% and stays there as long as the feature is selected. When I deselect the feature, the CPU usage goes back to 0-1% again, it's reproducible.
This happens both on my local pc (FME 2017.1) and on the remote desktop instance (FME 2016.1.2) that I tested.
After having looked into it, I think I've isolated the issue, which in fact looks like it's linked to whether the collapsed list of vertices is visible in the feature information window:
If you either add some attributes or make the Inspector window smaller so that the collapsed vertices aren't visible on screen, the CPU usage drops down to about zero. If I click on "Show All" the CPU usage also drops again. This was 100% reproducible on my PC.
Something funky is going on in the source code of that widget, Safe should definitely take a closer look.
Good detective work! I just assumed was because I was remote it was that, but as you say get the same issue locally.
Collapsing the entire coordinate node also works to reduce the CPU back to normal levels.
Good detective work! I just assumed was because I was remote it was that, but as you say get the same issue locally.
Collapsing the entire coordinate node also works to reduce the CPU back to normal levels.
Yes, it seems that it's the "on-screen presence" of that particular widget that's the issue.
I use FME via windows remote desktop every Monday and Friday and have never noticed any issues.
Normally OK for me as well, but have seen this before and today it really bugged me enough to ask!
As @david_r found not just related to remote desktop, but local processes. I guess when affects the Remote Desktop process maybe it is more obvious.
Yes, it seems that it's the "on-screen presence" of that particular widget that's the issue.
Logged with Safe Support - will post back any updates