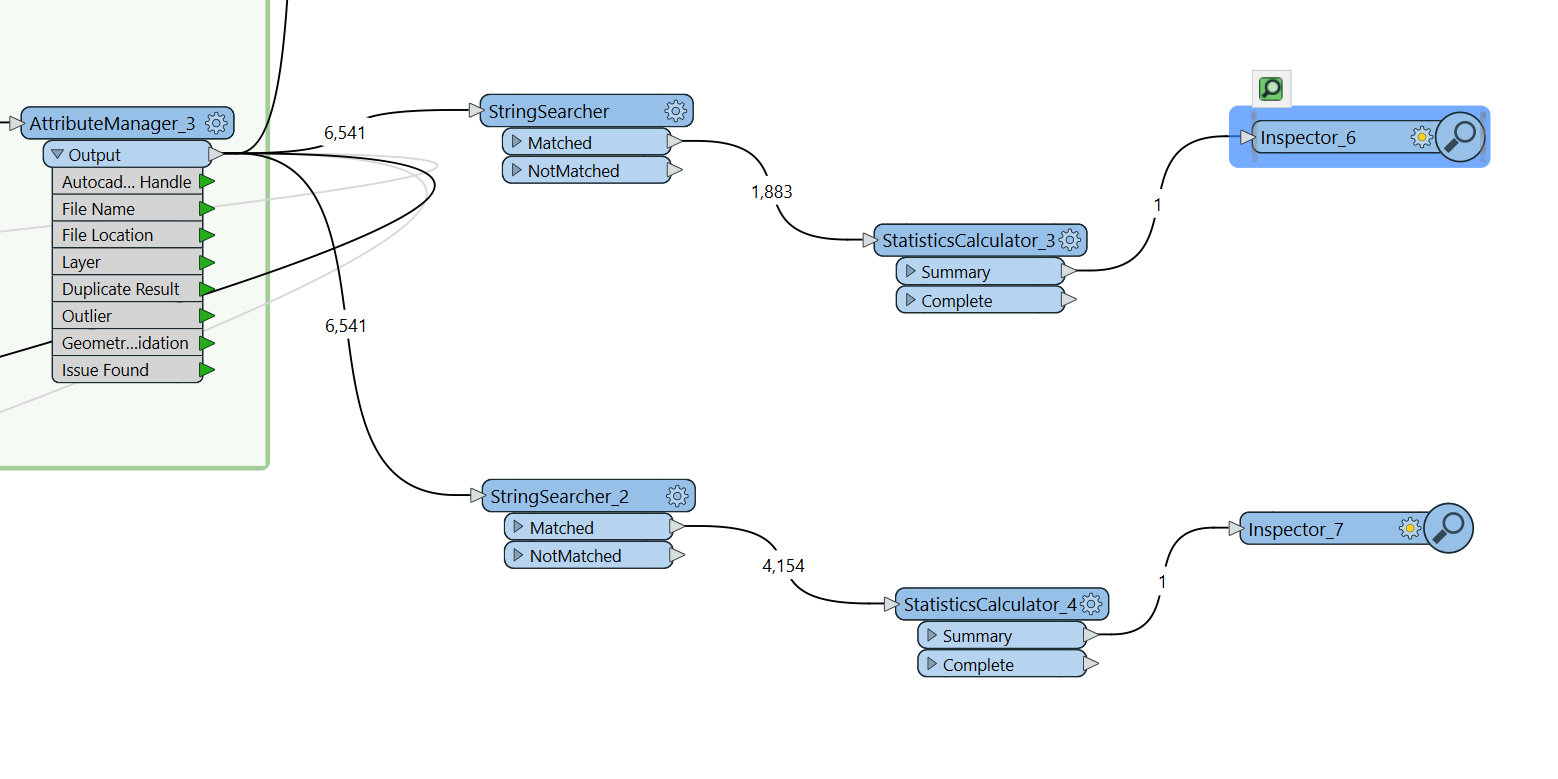
Hi, I'm basically trying to create a dashboard summary of my data but in the statistics stage, want to clarify I'm heading in the right direction as my knowledge of transformers is still young.
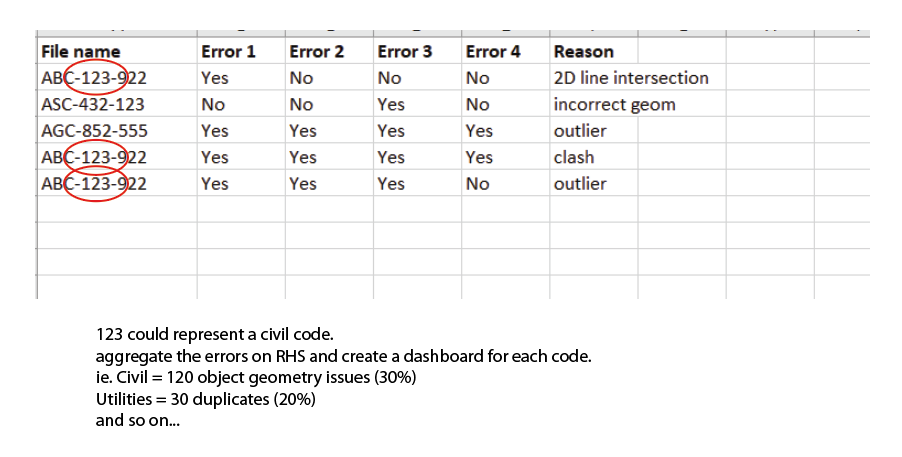
I'm aggregating information based on a string searcher and want to collect all the object errors from the files and output them with the code name.
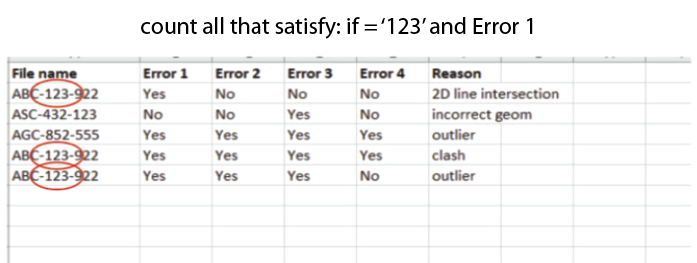
Hopefully this makes sense with the assistance of the below images (spreadsheet snip is a distilled version of what is in my attribute manager), in short aiming to get utilities - 10 duplicates, 5 outliers, Road - 20 duplicates, 10 outliers etc.
Thank you.


