I'm having some weird behaviour with my FME server in the Cloud that I could not explain.

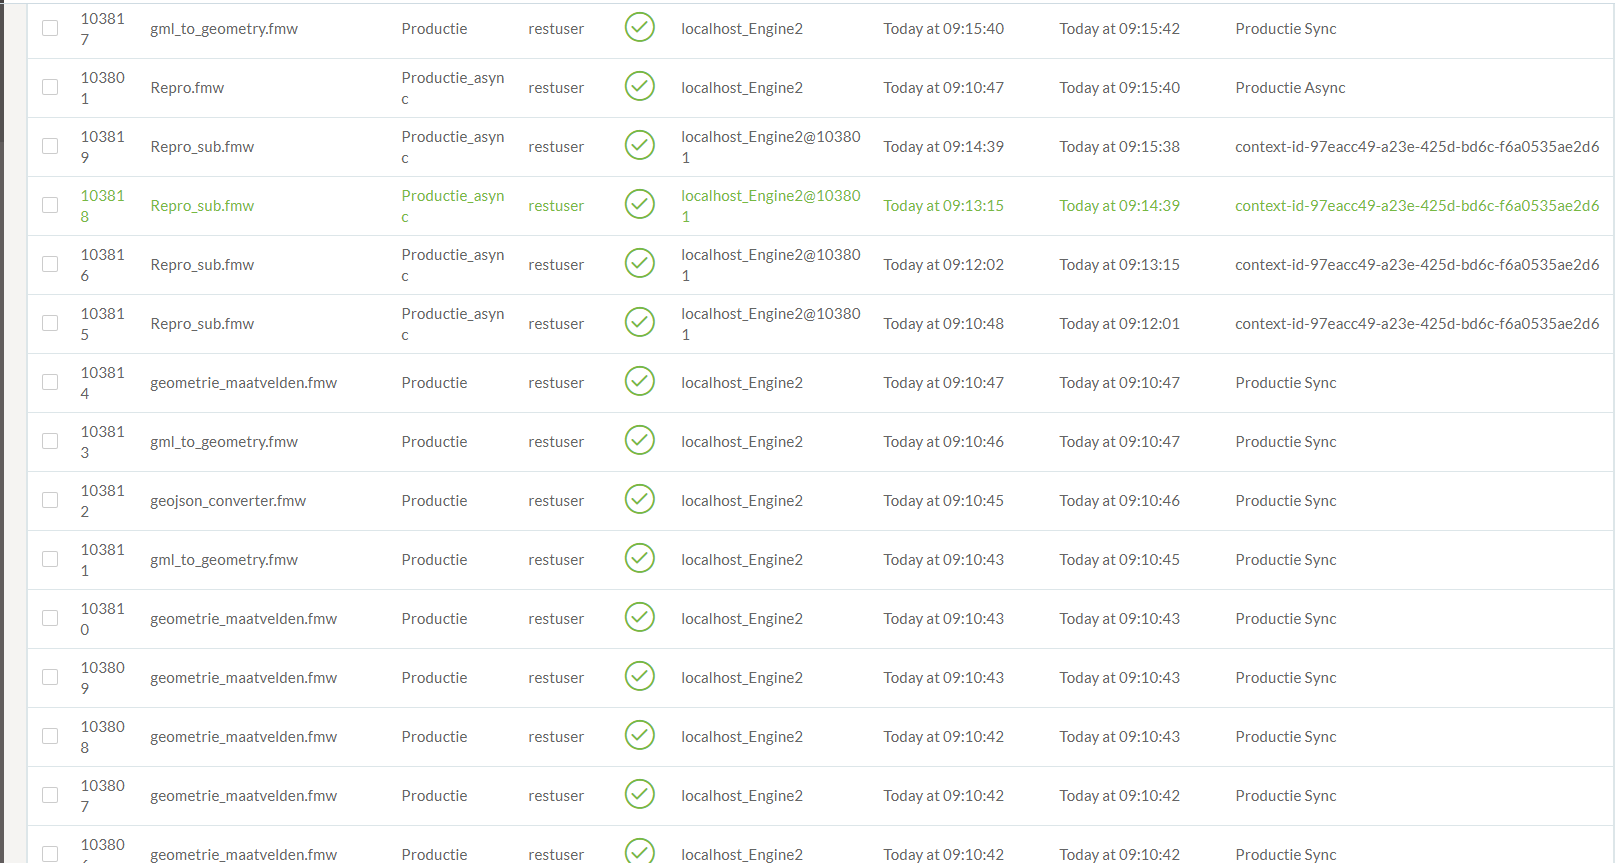
We are using a server that has three active engines and the following Queue-system:

This morning we had a workflow in our production sync queue that took way to many resources and time to process and was aborted. Somehow the server had some problems after (or during/before?) this because all new jobs where not properly handled and all got queued in line. Only engine 2 took was able to start new jobs even tho the other two engines where free and not running. With a unstable and high load as result (20000ms response time and server load of 100) and two engines IDLE. To compare it: Normally our response time is 5ms with an average load of between 0.10 and 0.50.

A reboot was needed for the server to stop the load en activate the other 2 engines.
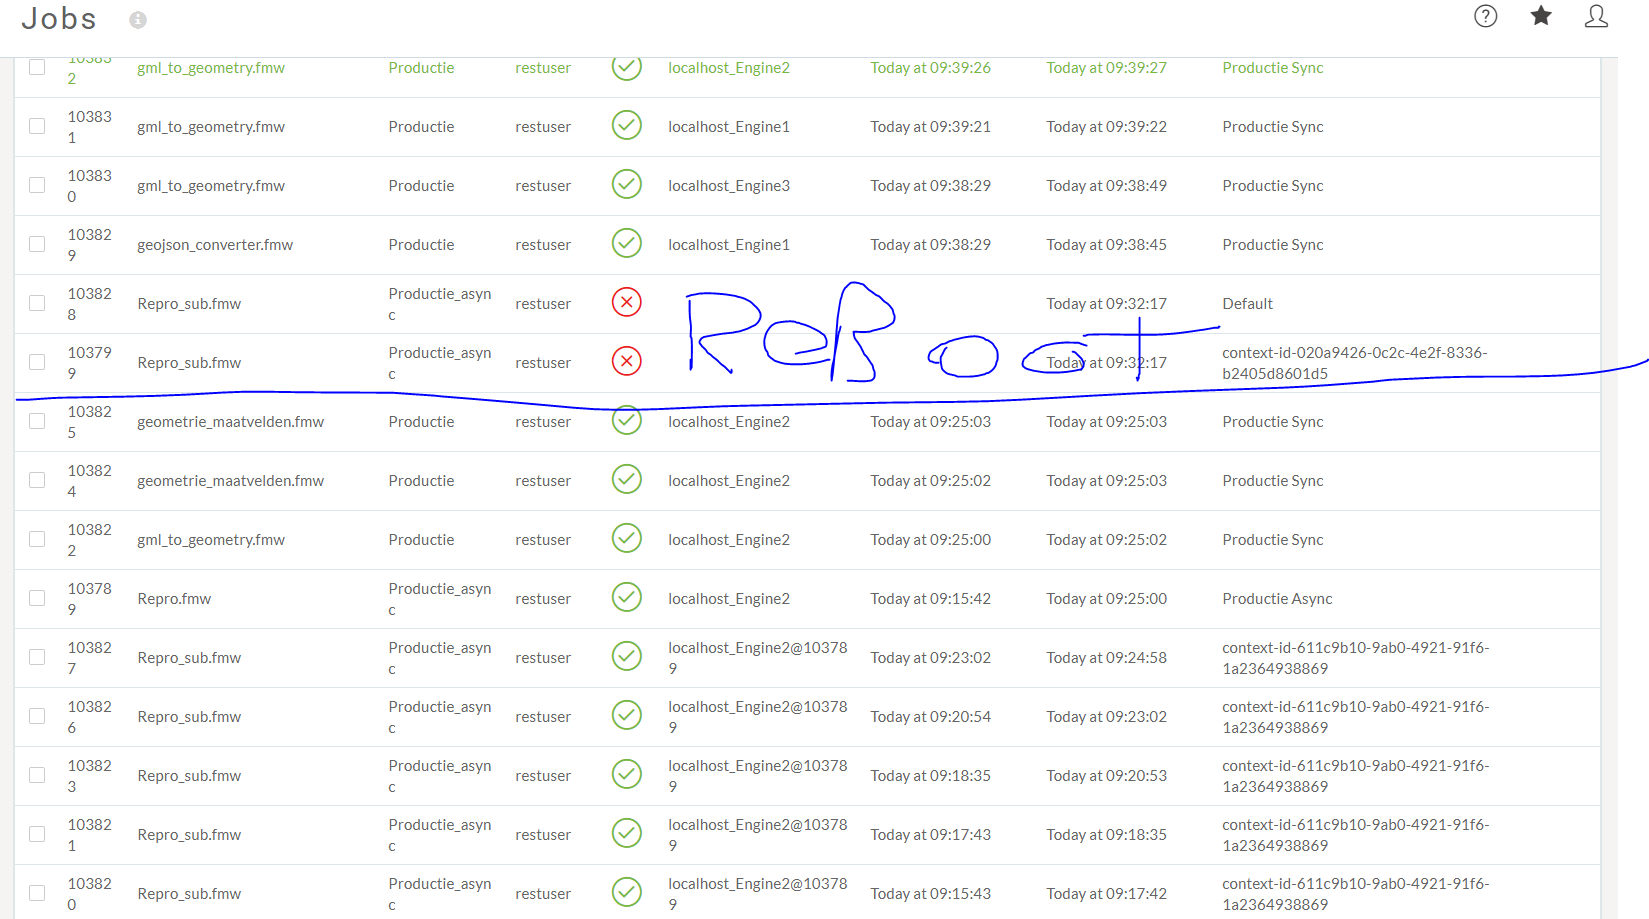
Is there any way to prevent this form happening again or a place where i can dig deeper into what could have caused this?


Unfortunately your images don't show up (at least not for me) so it's hard to give a definitive answer. One thing I noticed myself recently is that lack of temp disk space can cause a workspace to fail and this could potentially also cause instabilities.

Also, for clarification, are you using FME Cloud or an FME Server on a Cloud machine? There's some differences between them and it's not immediately clear from what you're writing.

I re-uploaded the images so you should be able to see them. We are using FME server in FME cloud with FME Build 18305. Both temp disk and Primary Disk have 50GB of space and are using 8GB and 4GB at that time. Due to the IOPS that is connected with the disk size we like to have a bit more.


I re-uploaded the images so you should be able to see them. We are using FME server in FME cloud with FME Build 18305. Both temp disk and Primary Disk have 50GB of space and are using 8GB and 4GB at that time. Due to the IOPS that is connected with the disk size we like to have a bit more.

Right, so disk space is not likely to be the cause of this. Still hard to say to be honest, is this a one-time thing or does it happen more often?


Have you looked in the server log files around the time of the problems?

In particular, it would be interesting to see if there were any warnings or error messages in either fmeserver.log or fmeprocessmonitorengine.log


Hi @JeroenR

By "aborted" do you mean that you manually canceled the job or did the job fail before you restarted the instance?

I would investigate the workspace to figure out why it would create such high load. Once the server load exceeds 100% processes will be queued up and therefore canceling the job can cause orphaned processes in rare cases, which can impair the server and require a reboot.

Judging from your screenshot this job is running pretty frequently without a problem. If there is some user input involved in the workflow you could, for example, try to guard against large upload or limit requests to APIs.


Reply