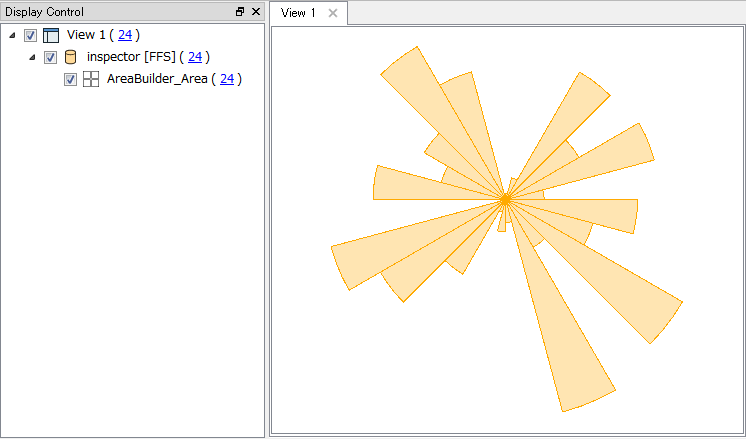
I am looking for a method to create a rose diagram using FME, which is essentially a circular histogram.


It appears FME is not able to produce a feature of this nature to add to maps unfortunately.

This website has examples of what I am trying to achieve.

https://help.rockware.com/rockworks17/WebHelp/rose_options.htm

Hi @grahamcain,

You can use a combination of the Rcaller transformer and an R package called ggplot2 to achieve this.

Here are some resources:

I'll also be posting a new article within the week about how to use ggmap which is an extention of ggplot2 and I'll link it to your question once I've posted it.

Hopefully, that helps you get started.

-Liz

Helpful indeed. It would be a very useful feature to have this in chartgenerator or something.


I'll test your instructions out and update with results.

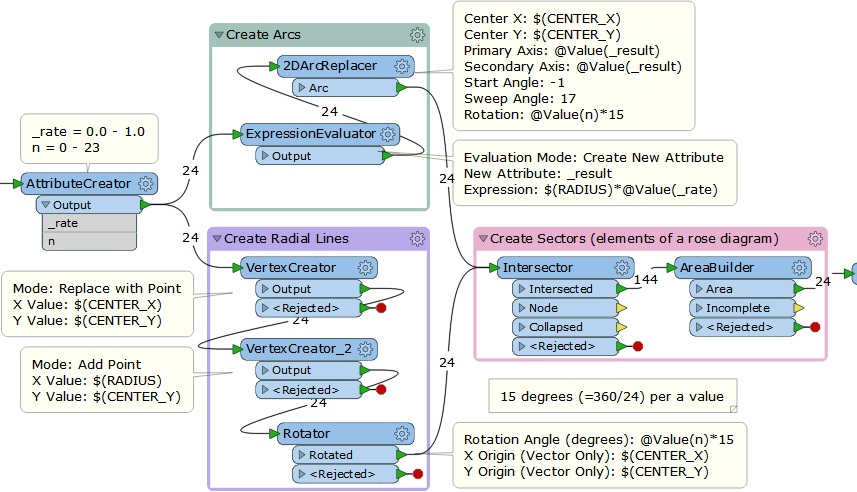
Hi @grahamcain, a rose diagram seems to consist of sectors. This workflow demonstrate a way to create 24 sectors (15 degrees per a sector) with FME.


Reply