Hello,
for a 3D visualization I would like to assign contaminant data from soil samples from varying intervals (e. g. 0,5 m) into a smaller interval of choice, e. g. 0,1 m.
An example of my input/original data and the desired output with a densification interval of 0,1 m is shown here:
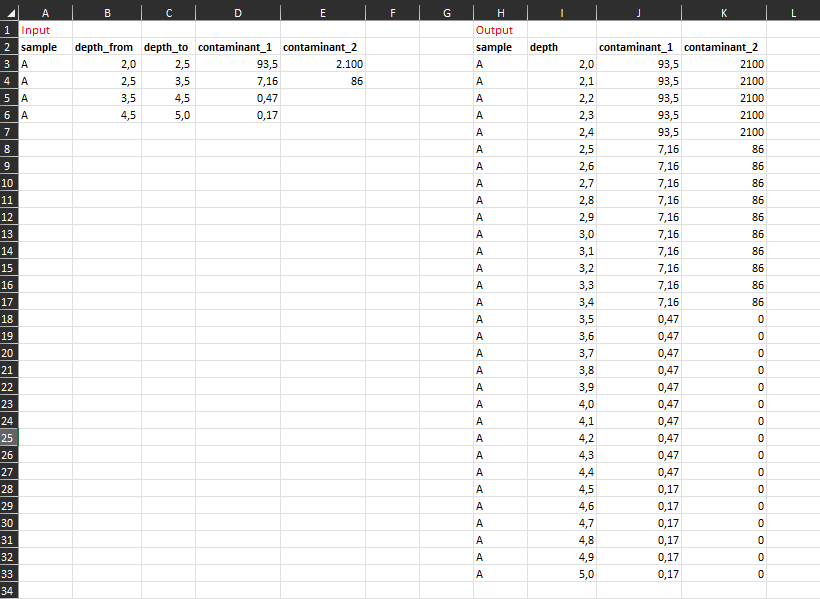 In our recent example, we have around 350 samples. By now, this is easy to solve with Excel formulas, but takes some time to process .
As I am quite new to FME but also in terms of a future automation – is there a quick to do this in FME? Or would a Python script be more practicable in this case?
Thanks for any hints and suggestions!
Kind regards
Alex


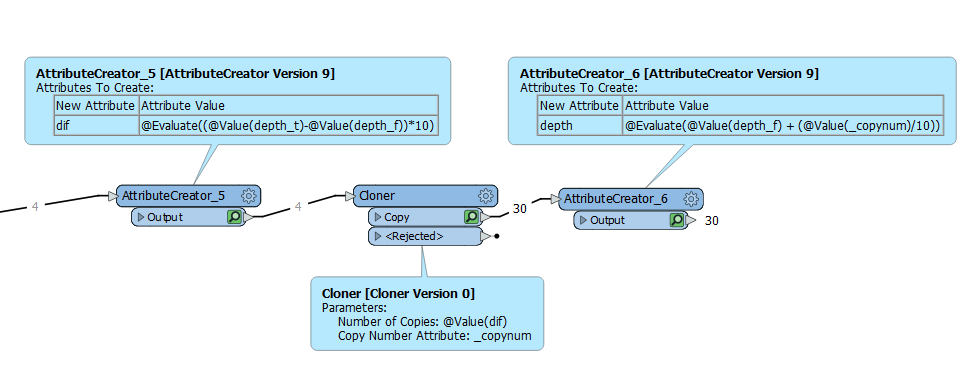
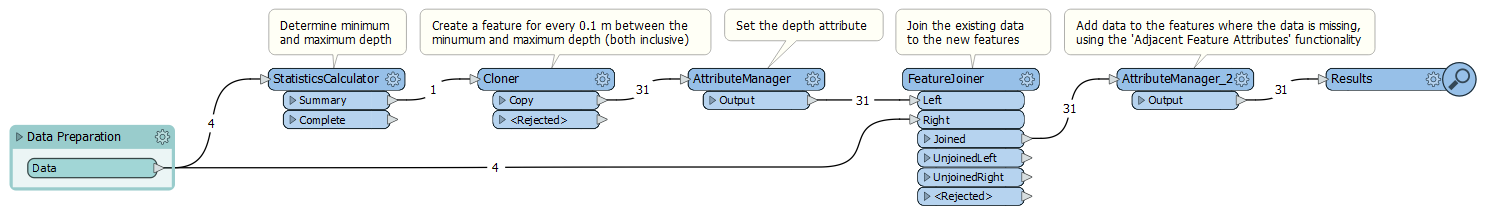 Create features for every 0.1 meters between the minimum and maximum depths, add the known data to the features with the corresponding depth, and finally fill in the gaps.