


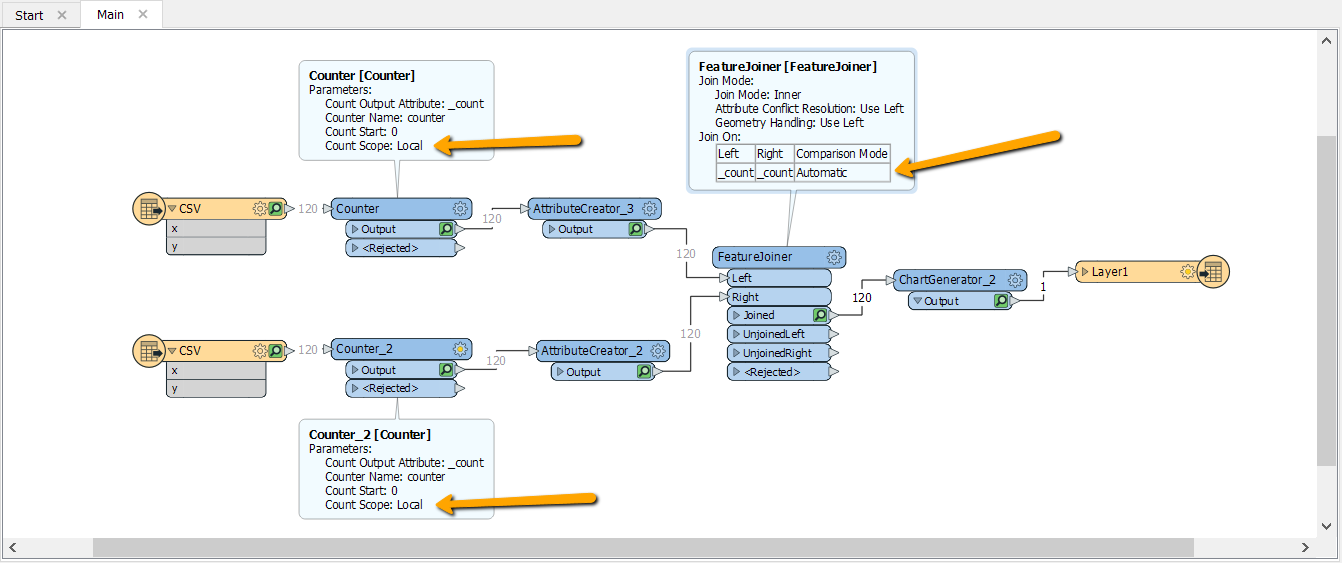
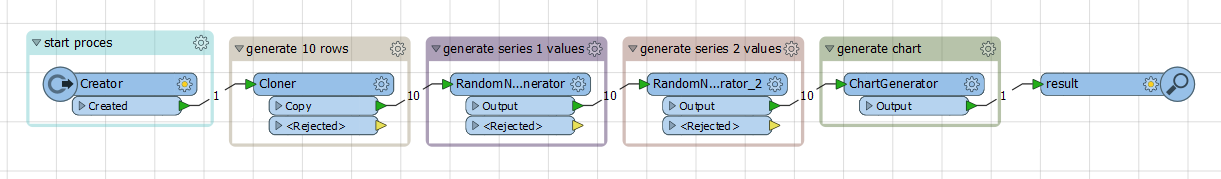
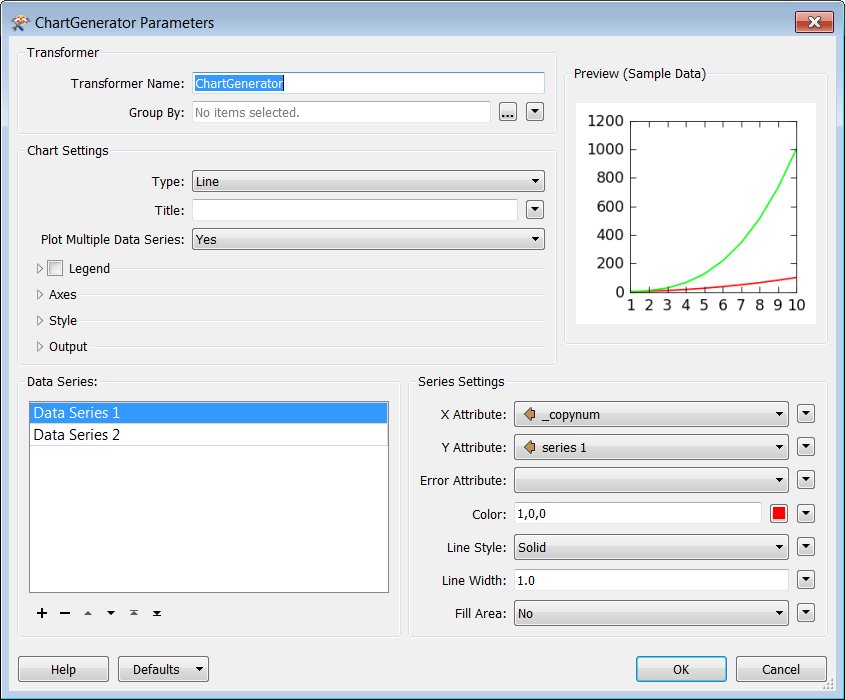
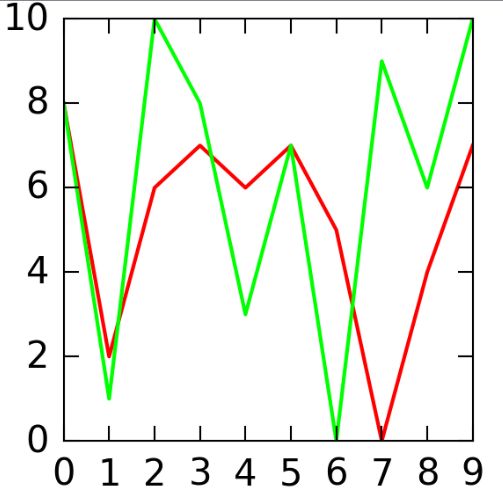
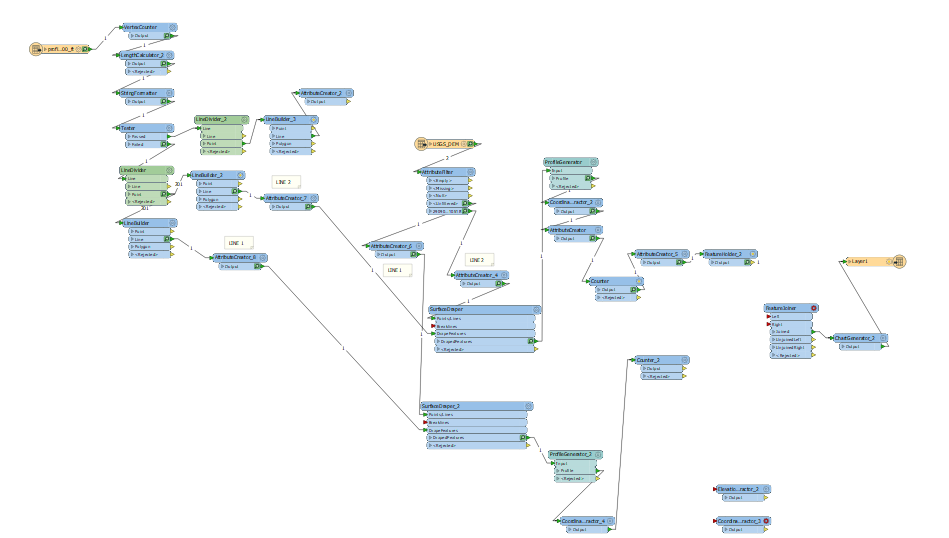
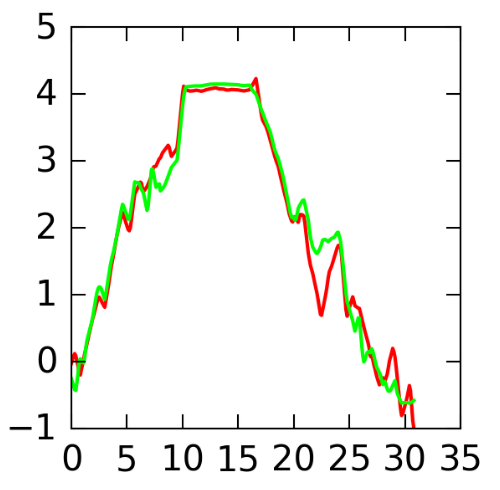
I am trying to make a chart with XY coordinates generated from the Profile Generator. I have two inputs and trying to plot both on the same chart with different color. I can run with one dataset, but when I try to run with data series it gives me this error: ChartGenerator: Non-numeric input provided. Please validate that the values of the "X Attribute","Y Attribute" and "Error Attribute" (if supplied) are numeric.


Reply
Rich Text Editor, editor1
Editor toolbars
Press ALT 0 for help
Helpful Members This Week


Enter your E-mail address. We'll send you an e-mail with instructions to reset your password.