Question

ChartGenerator - Line colour is not being honoured


kieranmg
Forum|alt.badge.img+3

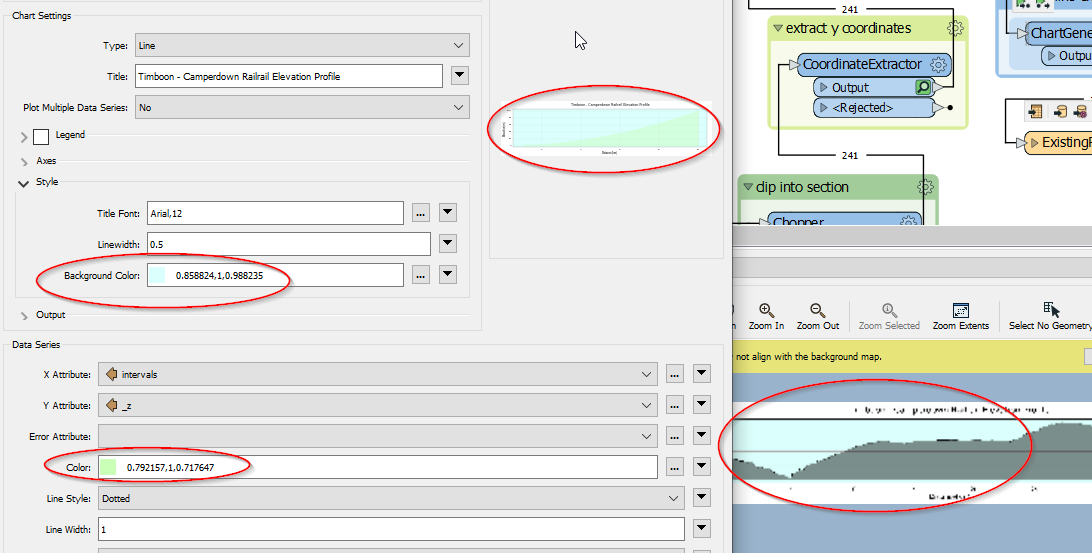
ChartGenerator doesn't seem to honour the 'fill' line colour. Anyone else have this problem?

Build: 2020.1.2.1 (20200909 - Build 20624 - WIN64)


2 replies

danilo_fme
Evangelist
Forum|alt.badge.img+41
  • Evangelist
  • October 7, 2020

Hi @kieranmg​ 

Could you share us the log file from FME Desktop?

Is better to check this problem.


Thanks in Advance,

Danilo


kieranmg
Forum|alt.badge.img+3
  • Author
  • October 7, 2020
danilo_fme wrote:

Hi @kieranmg​ 

Could you share us the log file from FME Desktop?

Is better to check this problem.


Thanks in Advance,

Danilo

2020-10-07 11:25:50|  0.6| 0.0|INFORM|mapping file Line 330: `FACTORY_DEF' `*' `BreakpointFactory' `FACTORY_NAME' `AttributeManager_OUTPUT Break Point -1 48' `INPUT' `FEATURE_TYPE' `AttributeManager_OUTPUT' `ID' `48_Main' `NAME' `AttributeManager [AttributeManager] : Output -> ChartGenerator [ChartGenerator] : Input' `ENABLED' `no' `ACTION' `BREAK' `OUTPUT' `OUT' `FEATURE_TYPE' `*' `@LogCount(LINK -1 48)'

2020-10-07 11:25:50|  0.6| 0.0|INFORM|mapping file Line 331: `FACTORY_DEF' `{*}' `TeeFactory' `INPUT' `FEATURE_TYPE' `AttributeManager_OUTPUT' `OUTPUT' `{' `FEATURE_TYPE' `ChartGenerator_PROCESSED' `fme_cg_chart_type' `Line' `fme_cg_chart_title' `Timboon<space>-<space>Camperdown<space>Railrail<space>Elevation<space>Profile' `fme_cg_chart_setup' `XATT;intervals;YATT;_z;EATT;;COLOR;0.792157,1,0.717647;LINE_STYLE;DOTTED;LINEWEIGHT;1;FILL_AREA;YES;DISCRETE_X;NO;DISCRETE_Y;NO;POINT_STYLE;NONE;LABEL_ANGLE;H' `fme_cg_x_label' `Distance<openparen>km<closeparen>' `fme_cg_y_label' `Elevation<openparen>m<closeparen>' `fme_cg_multi_ds' `NO' `fme_cg_legend' `<Unused>' `fme_cg_legend_options' `NO' `fme_cg_x_min' `' `fme_cg_y_min' `' `fme_cg_x_max' `' `fme_cg_y_max' `' `fme_cg_axes_lw' `0.5' `fme_cg_axes_font' `Arial<comma>12' `fme_cg_title_font' `Arial<comma>12' `fme_cg_legend_font' `<Unused>' `fme_cg_tick_font' `Arial<comma>10' `fme_cg_background_color' `0.858824<comma>1<comma>0.988235' `fme_cg_ticks' `G' `fme_cg_x_log' `LIN' `fme_cg_y_log' `LIN' `fme_cg_data_series' `' `fme_cg_xtick_interval' `' `fme_cg_ytick_interval' `' `fme_cg_x_inch' `15' `fme_cg_y_inch' `2.0' `fme_cg_dpi' `300' `}'

2020-10-07 11:25:50|  0.6| 0.0|INFORM|mapping file Line 332: `FACTORY_DEF' `*' `PythonFactory' `FACTORY_NAME' `ChartGenerator' `INPUT' `FEATURE_TYPE' `ChartGenerator_PROCESSED' `PYTHON_NAMESPACE' `FMEOBJECTS' `SYMBOL_NAME' `chartgenerator.ChartGenerator' `OUTPUT' `PYOUTPUT' `FEATURE_TYPE' `ChartGenerator_OUTPUT' `@RemoveAttributes(fme_cg_chart_type,fme_cg_chart_title,fme_cg_chart_setup,fme_cg_x_label,fme_cg_y_label,fme_cg_x_size,fme_cg_y_size,fme_cg_group_by,fme_cg_multi_ds,fme_cg_legend,fme_cg_x_min,fme_cg_y_min,fme_cg_x_max,fme_cg_y_max,fme_cg_axes_lw,fme_cg_axes_font,fme_cg_title_font,fme_cg_legend_font,fme_cg_tick_font,fme_cg_background_color,fme_cg_ticks,fme_cg_x_log,fme_cg_y_log,fme_cg_data_series,fme_cg_xtick_interval,fme_cg_ytick_interval,fme_cg_out_scheme,fme_cg_x_inch,fme_cg_y_inch,fme_cg_dpi)' `@ReinterpretRaster(RASTER,RGBA32,AVERAGE,DROPALPHA,TYPESCALE,BOUNDED_CAST,DATASCALE,BOUNDED_CAST,ROUND,CREATEOPAQUEALPHA)'


chartgenerator

The preview is the same as the writer output, dark-grey instead of green


Cookie policy

We use cookies to enhance and personalize your experience. If you accept you agree to our full cookie policy. Learn more about our cookies.

 
Cookie settings