I'm working with the ChartGenerator Transformer to create a bar chart and have two questions:
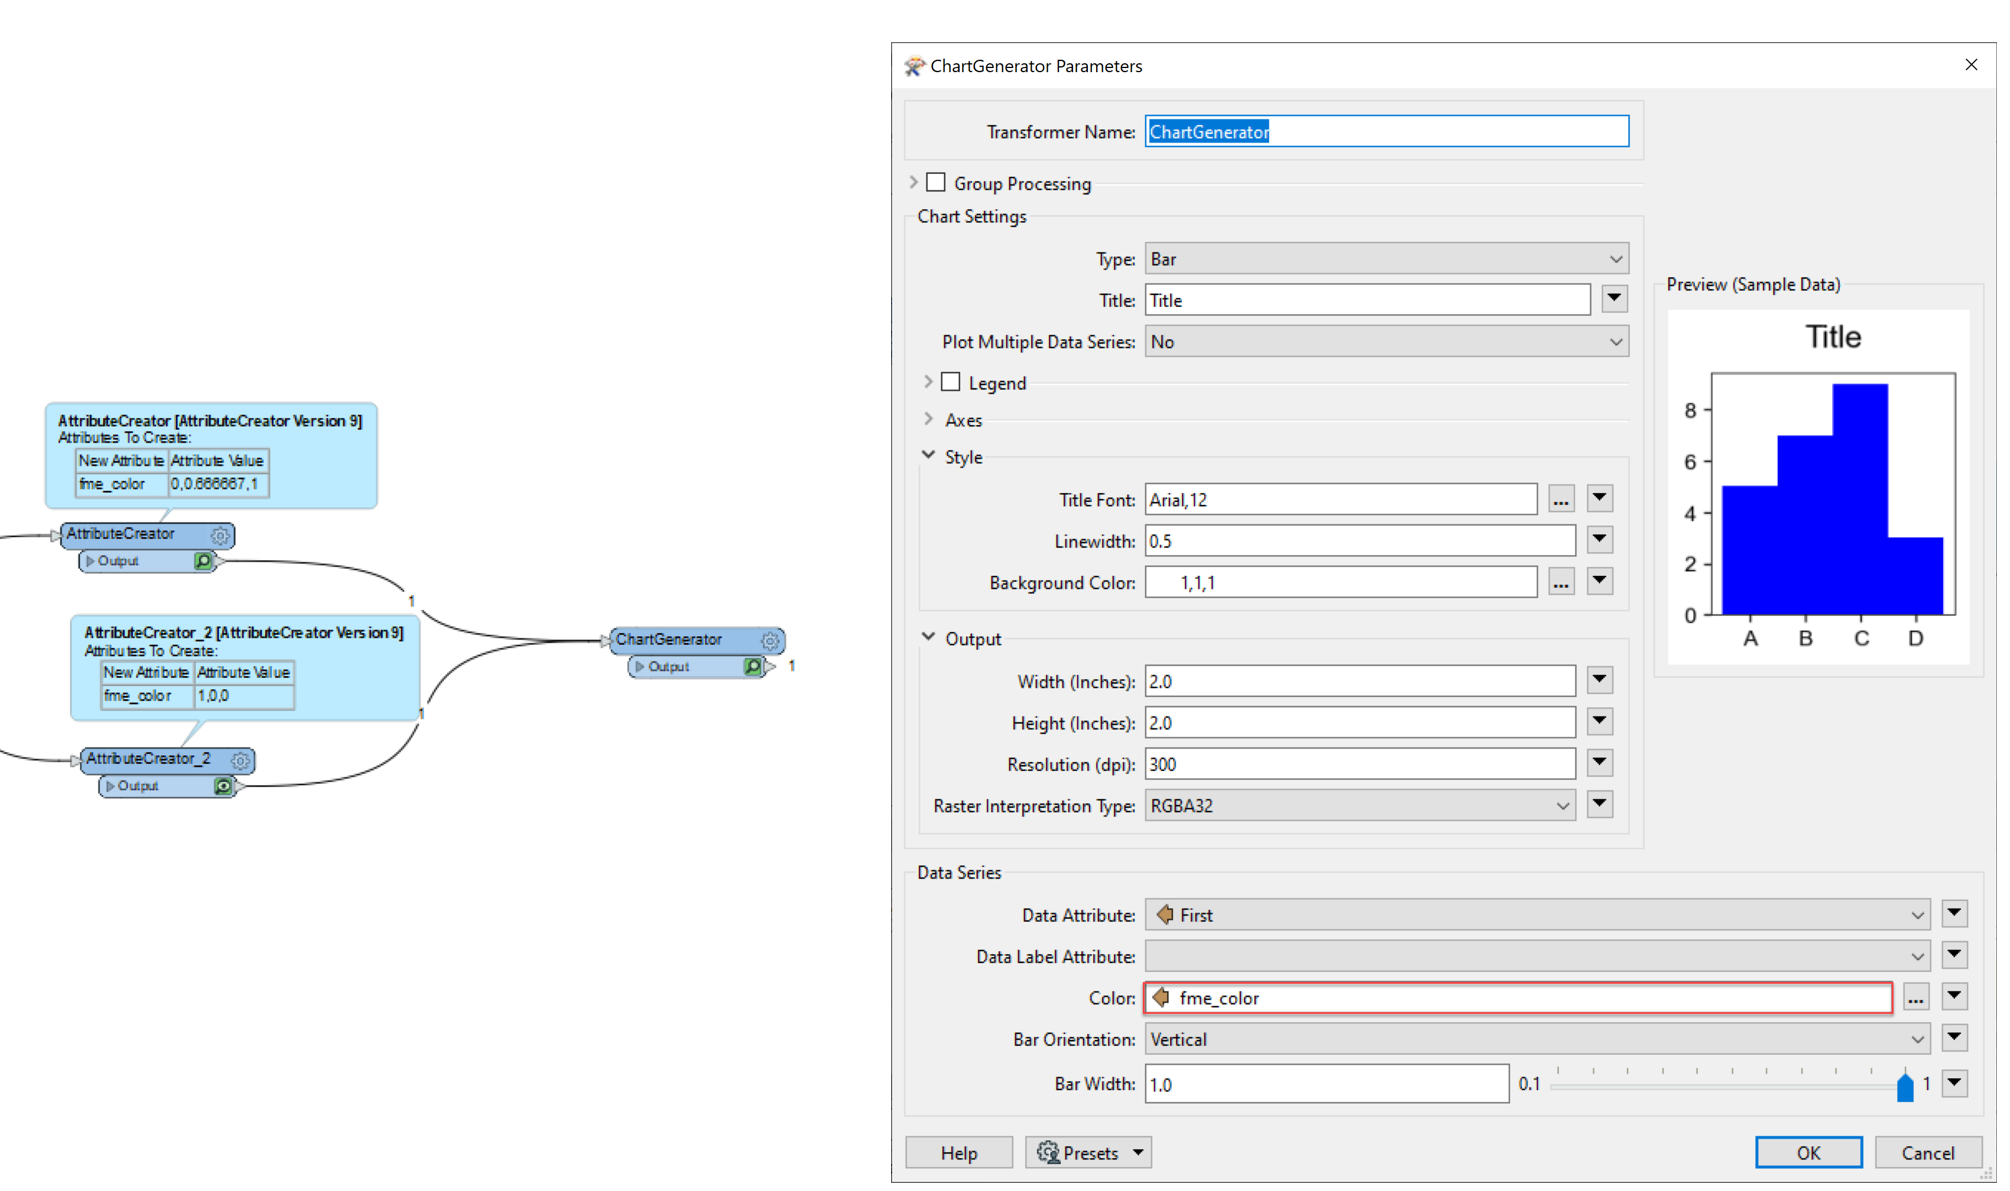
1) How can I change the bar colour so each bar is a different color? I did find a post to change the RGB to (0-1,0-1,0-1), but my entry is still pink, so I can't use that.
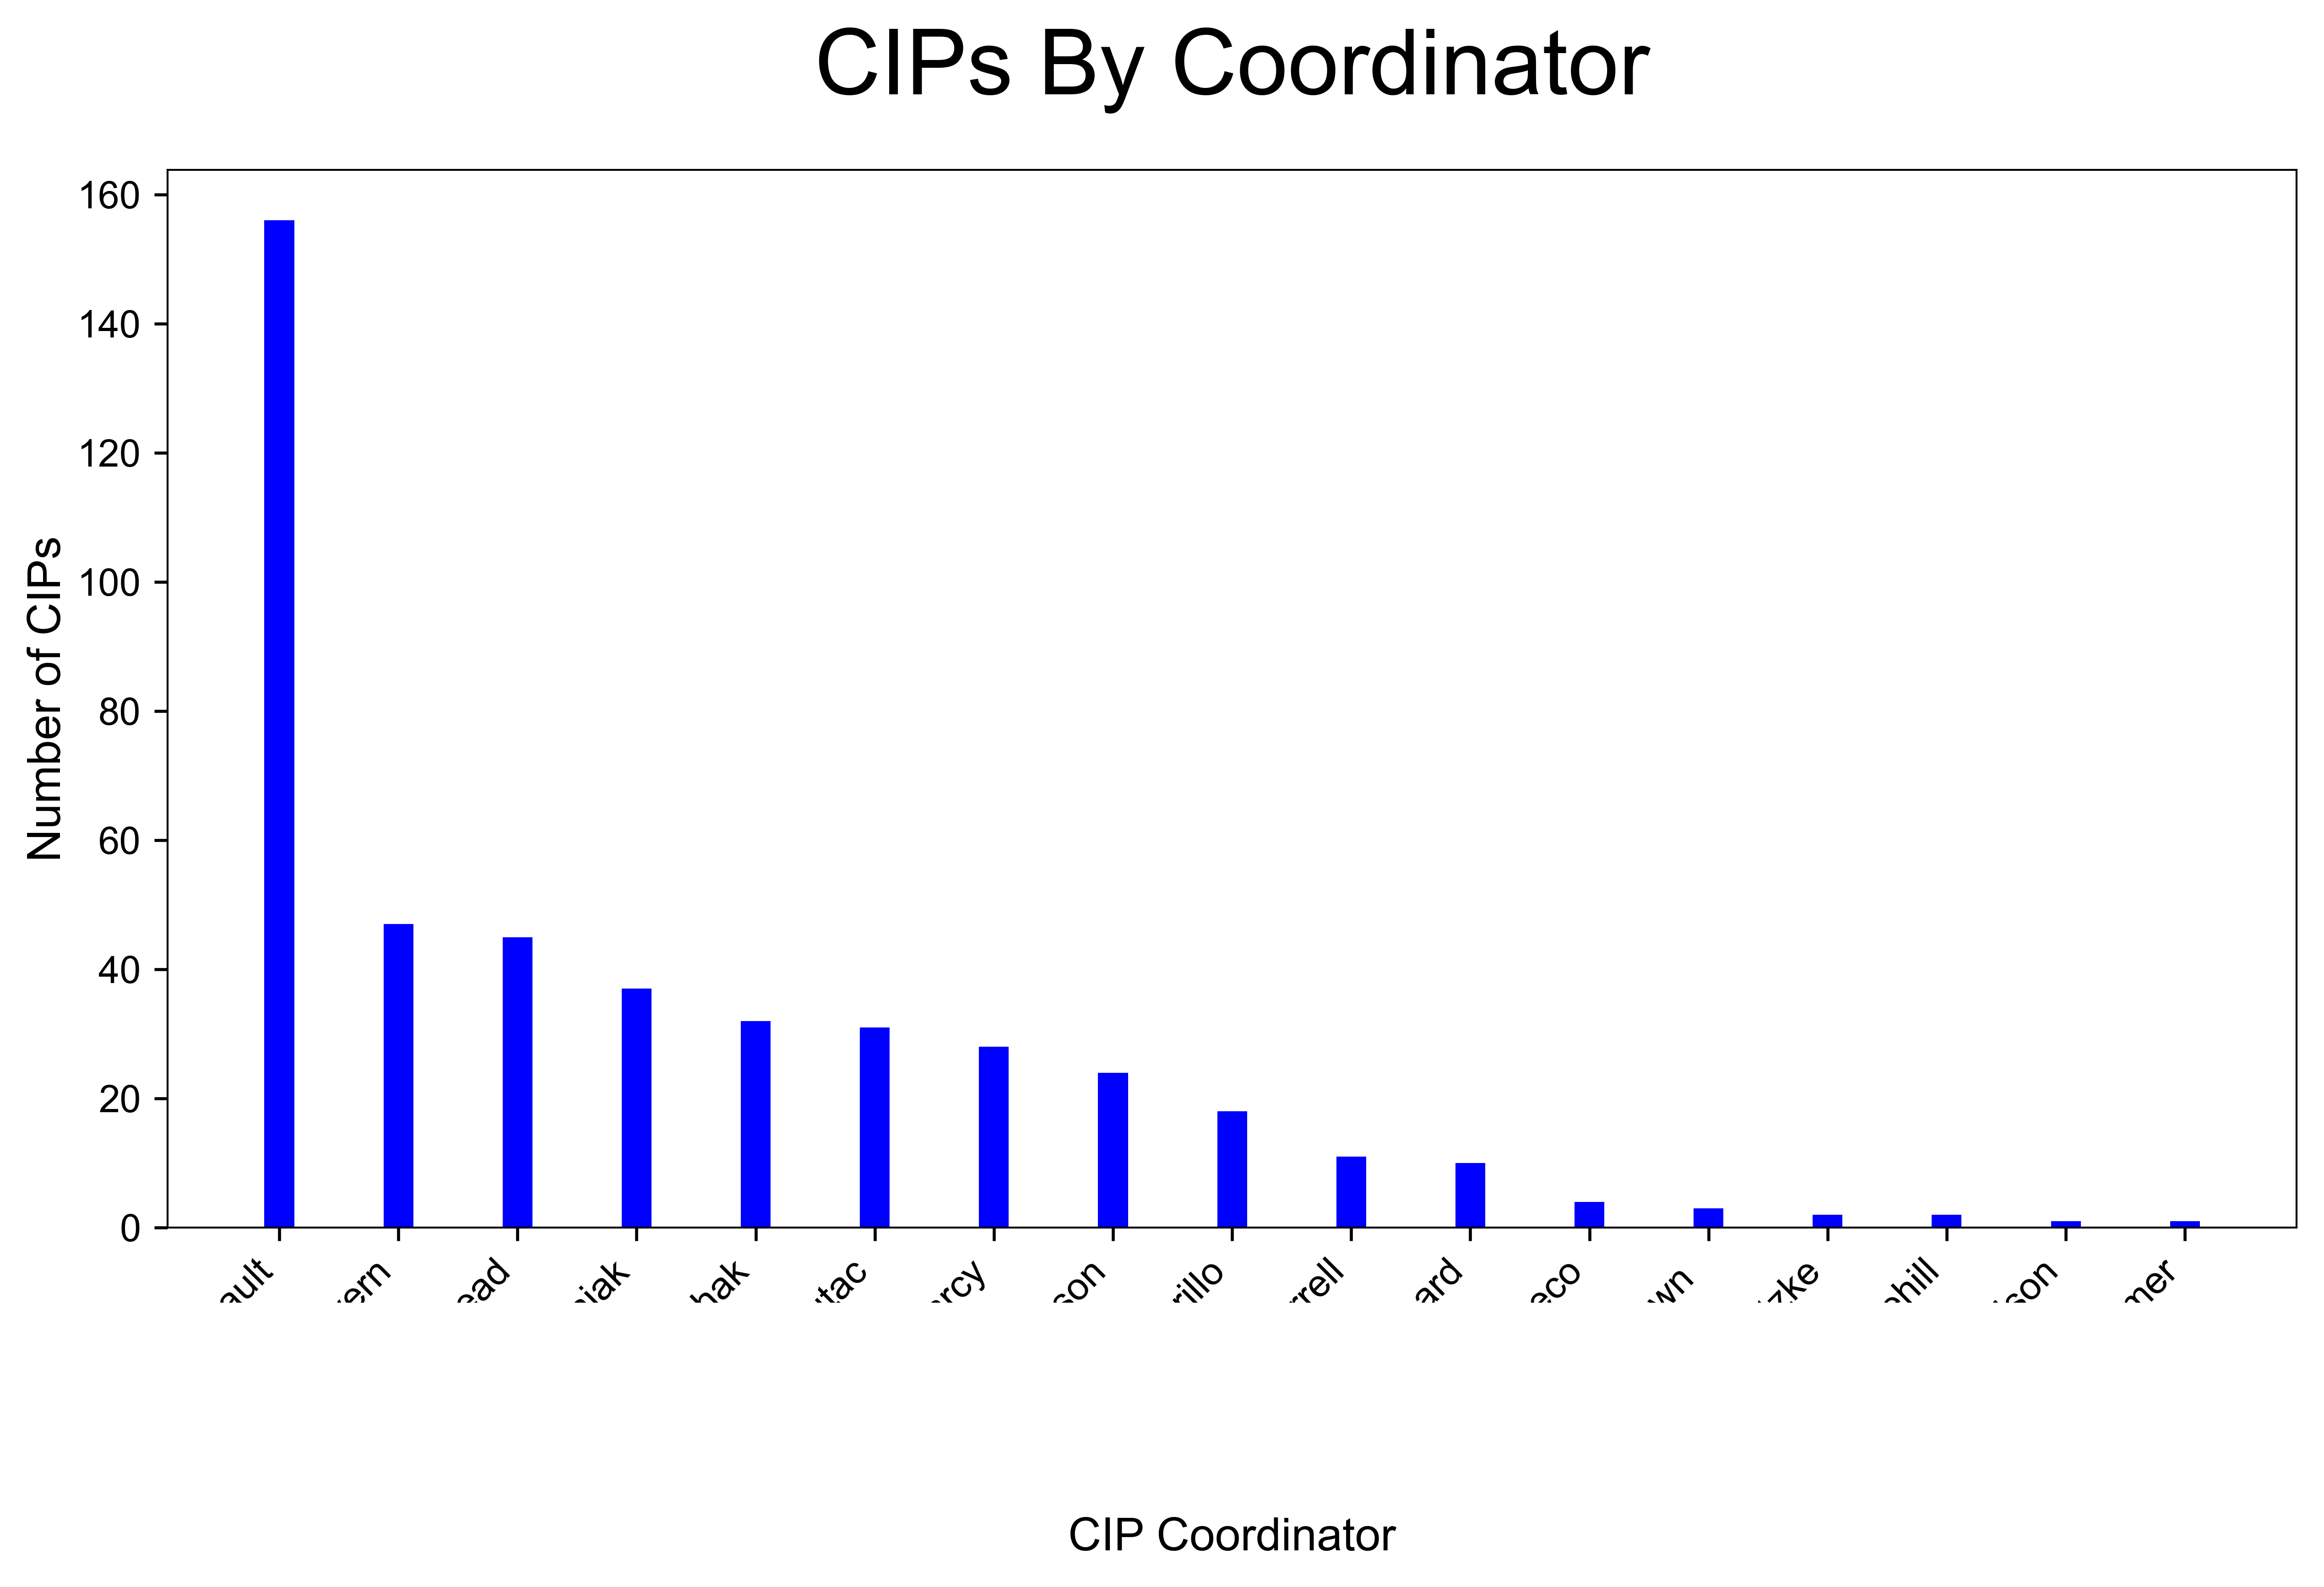
 2) How can I add a label showing the number of items at the top of each bar? The PowerPiontStyler has an option for "Label Data", but I don't see one within the ChartGenerator. Currently, my table is shown like this:
 Thanks in advance!


