Question

Comparing similar geometry from two files


davethebrave
Contributor
Forum|alt.badge.img+3

Hi all


I am trying to compare two databases which contain similar and different geometry files. I am trying to figure out which geometry's are the same and which are unique to each database.  


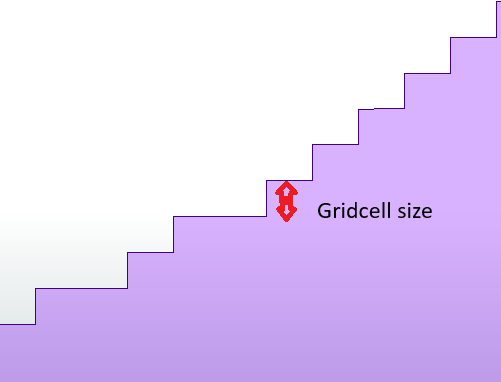
A few big issues I have is the complex of the geometry and even the SAME geometry's has been captured slightly differently; even thou it's of the same area.

I also have no data to help identify which geometry's are the same.

Example of 2 similar complex geometry's - zoom in to show compilation differences

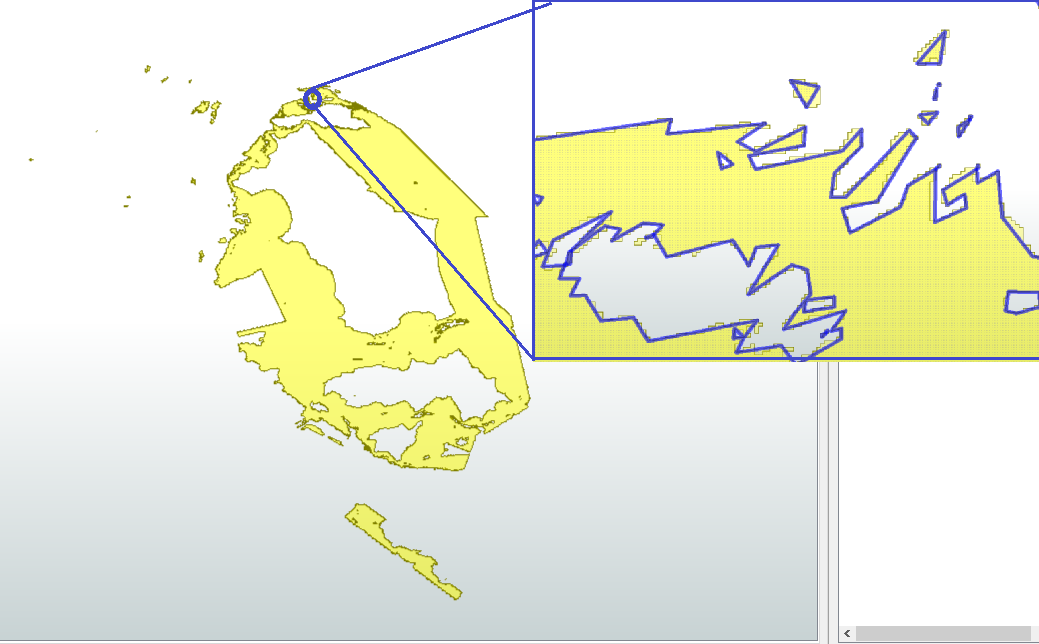
I am currently struggling to figure the best solution to my problem, the geometry can be complex with donuts and multiple areas representing the “same” geometry. I can't find the sweat when I simplify the data enough to get a match and not corrupt the data too much that everything matches. 

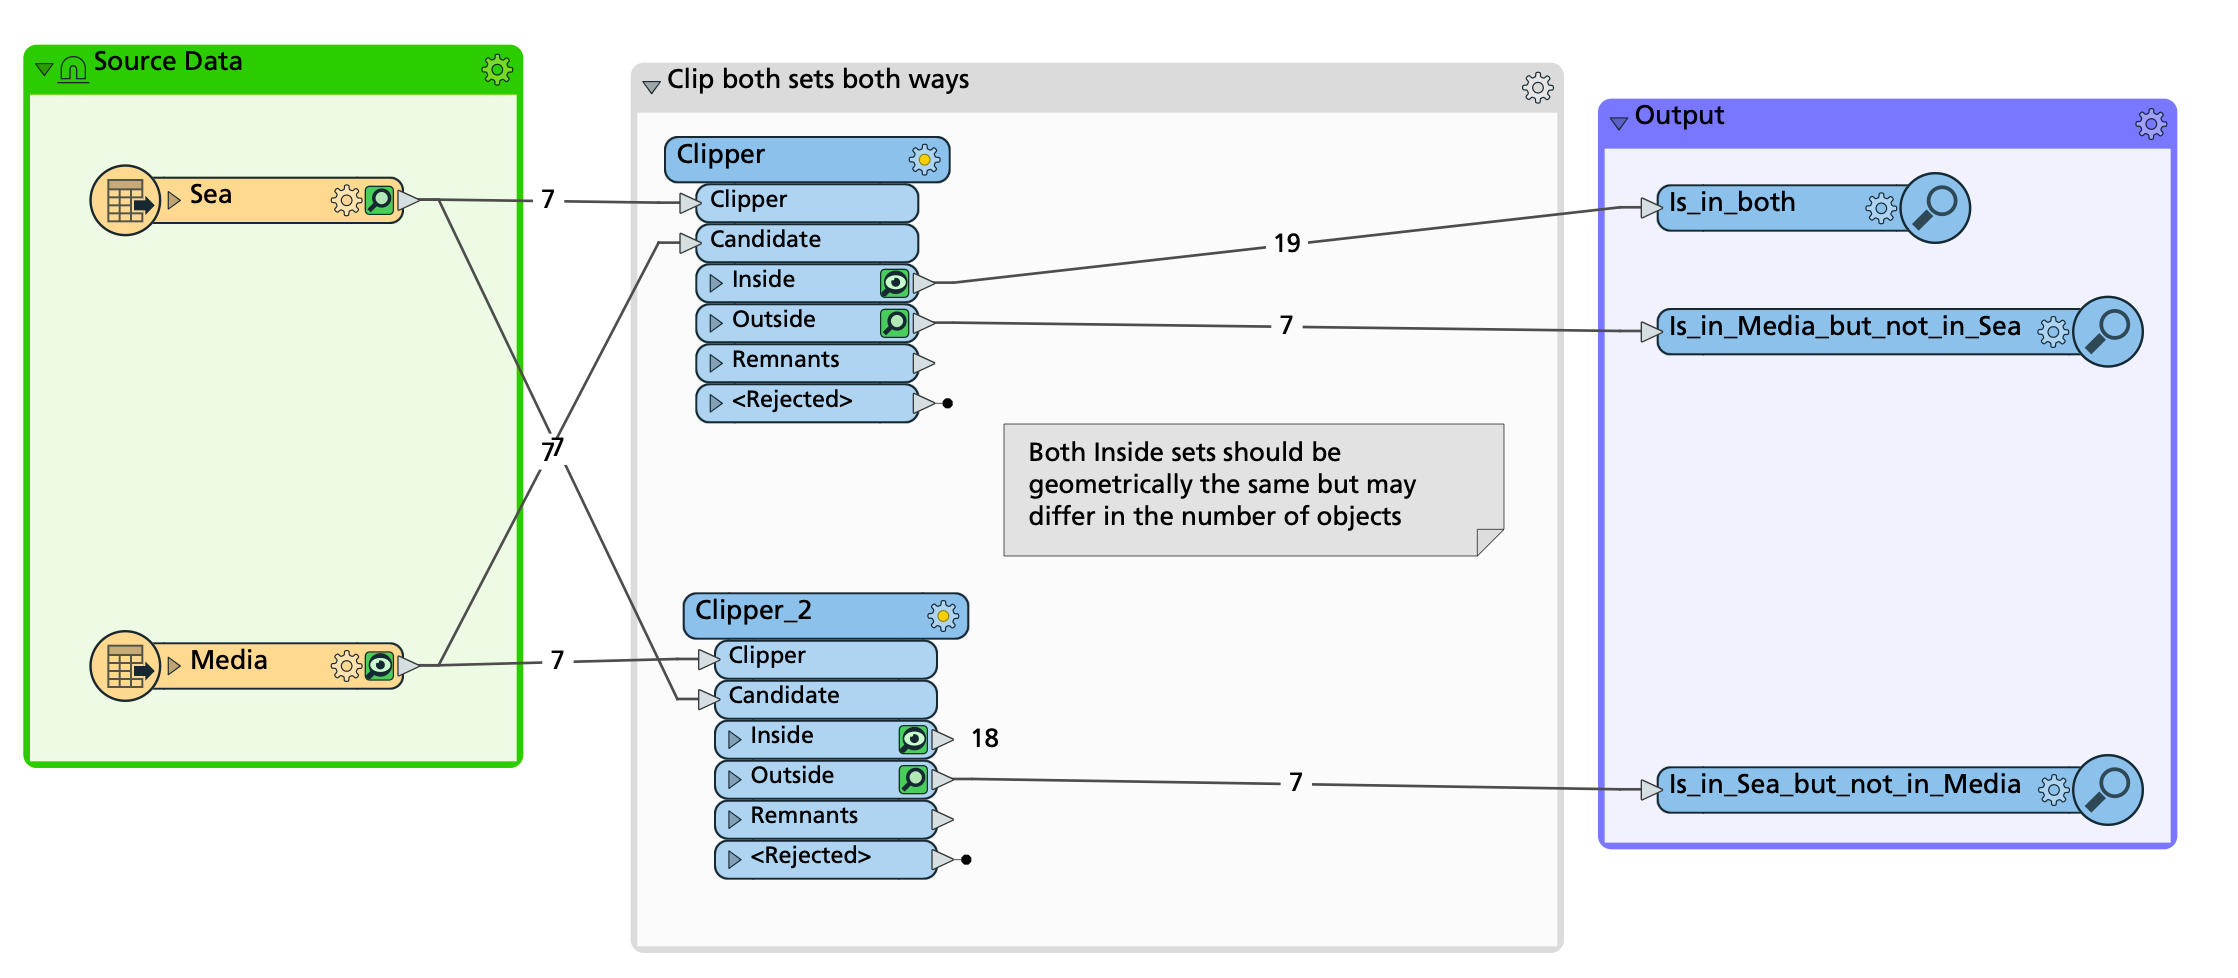
I have added two SHAPE file, containing 7 Features each, with 6 that should match and 1 that should not.

Any help or ideas would be appreciated

12 replies

redgeographics
Celebrity
Forum|alt.badge.img+47

What I did was this:

Probably a different approach. Since 1 feature in Sea may be represented by multiple features in Media and the other way around I figured I’d check which areas are only covered in one of the sets.

If they are slightly different you may get a lot of noise along the edges. If you don’t want that I would recommend using an AnchoredSnapper before the Clippers, using one of the sets as Anchor and the other one as Candidate and then pick a low tolerance.


davethebrave
Contributor
Forum|alt.badge.img+3
  • Author
  • Contributor
  • January 16, 2025

Thanks for the Interesting solution, the one big issue is that overlapping polygons will give the impression that both polygons are “covered” when its only one.

I only provided a small sample of the data I have. I have thousands more, and each polygon is a boundary representing unique data. I need to know if I have the same boundary in the other database, rather than general coverage of the same area….if you know what I mean


liamfez
Influencer
Forum|alt.badge.img+34
  • Influencer
  • January 16, 2025

Just an idea I had to help identify boundaries which could be the same, since you are saying generalizing is not proving successful (and I can understand why).

Assuming any two boundaries are roughly similar from the two datasets, you could try creating centroids for the polygons and then matching centroids within a certain distance of each other. They should be fairly close. Now it is also possible that other boundaries that should not match would also have a very similar centroid, but hoping that it is not a lot you could then compare the areas of just those that have similar centroids to each other looking for a given %area overlap. And then you would need to make the determination that any two boundaries that overlap say 95% of each other could then be matching.

Not sure if that makes sense but that is the idea I was having. I am going to download the data and play around with it as well.


hkingsbury
Celebrity
Forum|alt.badge.img+50
  • Celebrity
  • January 17, 2025

I wonder if you could spatially join them and then look at the difference in area of the spatially related geometries.If the geometries are touching and have a very similar area, then its likely that they are (nearly) the same


davethebrave
Contributor
Forum|alt.badge.img+3
  • Author
  • Contributor
  • January 17, 2025

Let me know how it goes liamfez, open to any ideas, and it sounds like a promising solution.


virtualcitymatt
Celebrity
Forum|alt.badge.img+34
liamfez wrote:

Just an idea I had to help identify boundaries which could be the same, since you are saying generalizing is not proving successful (and I can understand why).

Assuming any two boundaries are roughly similar from the two datasets, you could try creating centroids for the polygons and then matching centroids within a certain distance of each other. They should be fairly close. Now it is also possible that other boundaries that should not match would also have a very similar centroid, but hoping that it is not a lot you could then compare the areas of just those that have similar centroids to each other looking for a given %area overlap. And then you would need to make the determination that any two boundaries that overlap say 95% of each other could then be matching.

Not sure if that makes sense but that is the idea I was having. I am going to download the data and play around with it as well.

Overlap % and checking centroid distance would also be my suggestion.  


s.jager
Influencer
Forum|alt.badge.img+16
  • Influencer
  • January 17, 2025

Using the Matcher, with only Check Geometry, Lenient Geometry Matching in 2D, and a vector tolerance of 1, I get 5 matches. Unfortunately not the one you show in your screenshot, but at least it’s something. Playing with the settings might generate more.

One of the things you might also try is changing the polygons to lines (create an ID on every polygon first, so you know which lines belong to which polygon!), then use the SherbendGeneralizer to smooth out the linework. Then add a buffer around the polylines, and see if you can find matches between the buffered lines. Or convert the lines back into their polygons, and try to match again.

Another option would be to create a grid, split all your polygons along that grid, then check per gridcell how much of each polygon matches with the other dataset (equally split up).

Definitely a very interesting challenge, I’ll think about it some more, see if I can come up with other approaches.


s.jager
Influencer
Forum|alt.badge.img+16
  • Influencer
  • January 17, 2025

Thinking about the gridcell-solution a bit more: you could try this:

create a grid that overlaps all of your data, give every gridcell a unique ID.

determine which gridcells fall completely inside each polygon

compare those gridcell-lists: if they have more orr less exactly the same gridcells, you can be quite sure the polygons are similar.


Got that idea because the data looks like it was generated from rasters. If these were rasters, this would be simpler because you can match each pixel. So using the gridcell method, you can duplicate that. Ideally you’d choose a gridcell-size that more or less matches the pixel-size of the orginal data.


davethebrave
Contributor
Forum|alt.badge.img+3
  • Author
  • Contributor
  • January 20, 2025

Thanks for the reply's, all, helping me test a few more options in trying to get the best results.

Further questions for s.jagers idea with using Grids, im no expert yet in using FME, so can anyone help me build the model I need to test this theory...starting with the data and a 2DGridAccumulor → UniqueIdentifierGenerator…..but not sure best steps to do after this.
 

Cheers


liamfez
Influencer
Forum|alt.badge.img+34
  • Influencer
  • January 21, 2025

@davethebrave ​@virtualcitymatt Attached is the workspace setup that I was imagining. I have created 2 parameters to control the centroid distance and percent area overlap. You will probably need to adjust these when testing with more data to refine the results. I also currently have it finding 3 neighbors, that value will also likely need adjusting.

There are other steps that you could potentially do before using these methods to improve results such as limited generalization, filling small holes, deaggregating and removing small parts, etc.


liamfez
Influencer
Forum|alt.badge.img+34
  • Influencer
  • January 21, 2025

Also as a note, for this test I used a centroid distance of 20km which may be fine but in order to achieve 6 out of 7 matches I had to reduce the area overlap to 65%. I think that is a bit low and those areas should probably not count as matching especially compared to the others. However generalizing and other cleanup prior to using the centroids and area overlap calculation would help. Just depends on your needs.


s.jager
Influencer
Forum|alt.badge.img+16
  • Influencer
  • January 22, 2025

Here's my example of gridcell matching. Right now it gives all overlaps, so a few false positives as well. But it should give you a good start. The StatisticsCalculator might also be a good idea, combined with a total number of gridcells per shape-feature. That gives you a percentage, where you can then use a threshold: for example 90% is a match on the whole feature, or something like that.


Cookie policy

We use cookies to enhance and personalize your experience. If you accept you agree to our full cookie policy. Learn more about our cookies.

 
Cookie settings