
Question
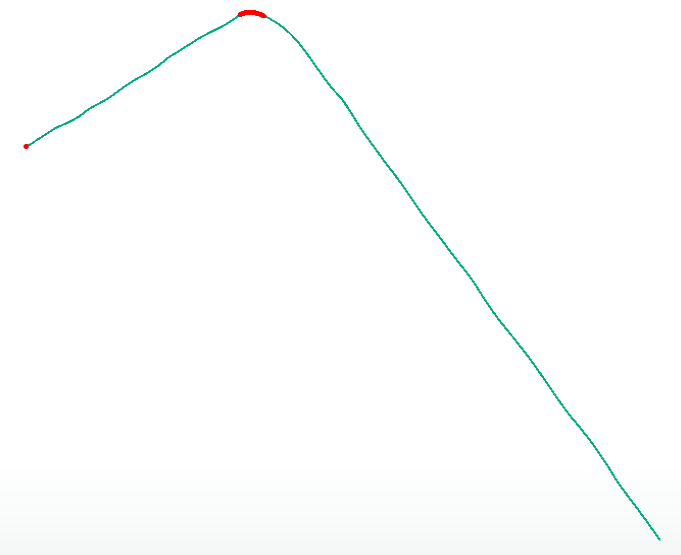
I have a 100 ft line that curves and then turns back into a straight line. How can I use FME to only gather the straight line after the curve only. I basically want to cut out the curve and only grab the line after the curve.
I have a 100 ft line that curves and then turns back into a straight line. How can I use FME to only gather the straight line after the curve only. I basically want to cut out the curve and only grab the line after the curve.
This post is closed to further activity.
It may be an old question, an answered question, an implemented idea, or a notification-only post.
Please check post dates before relying on any information in a question or answer.
For follow-up or related questions, please post a new question or idea.
If there is a genuine update to be made, please contact us and request that the post is reopened.


")
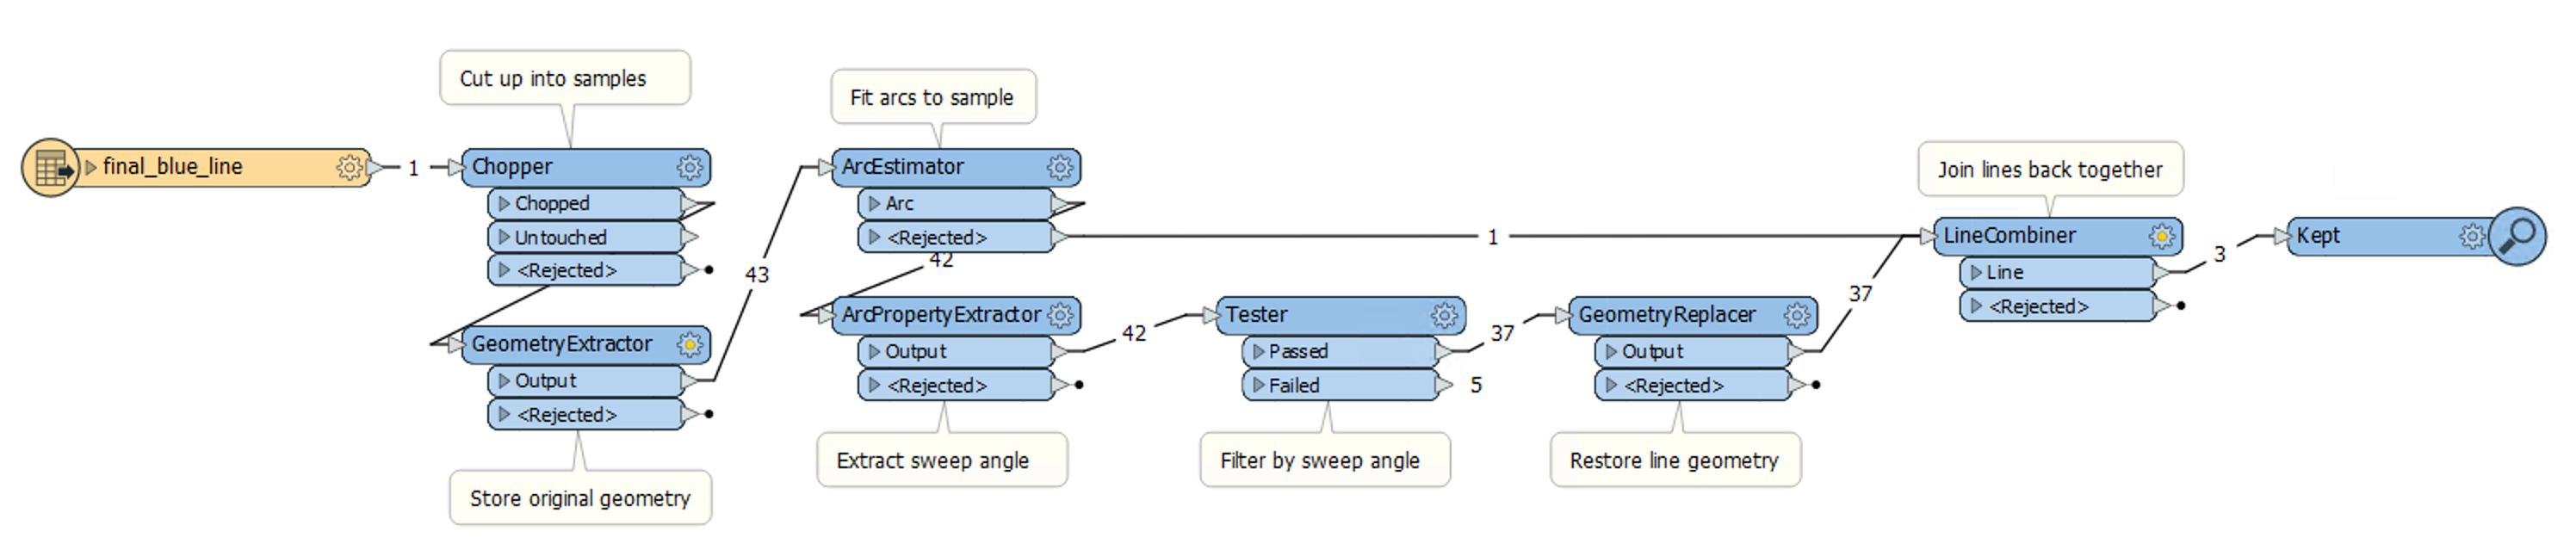
 As a bonus, there is no math required 😀 .
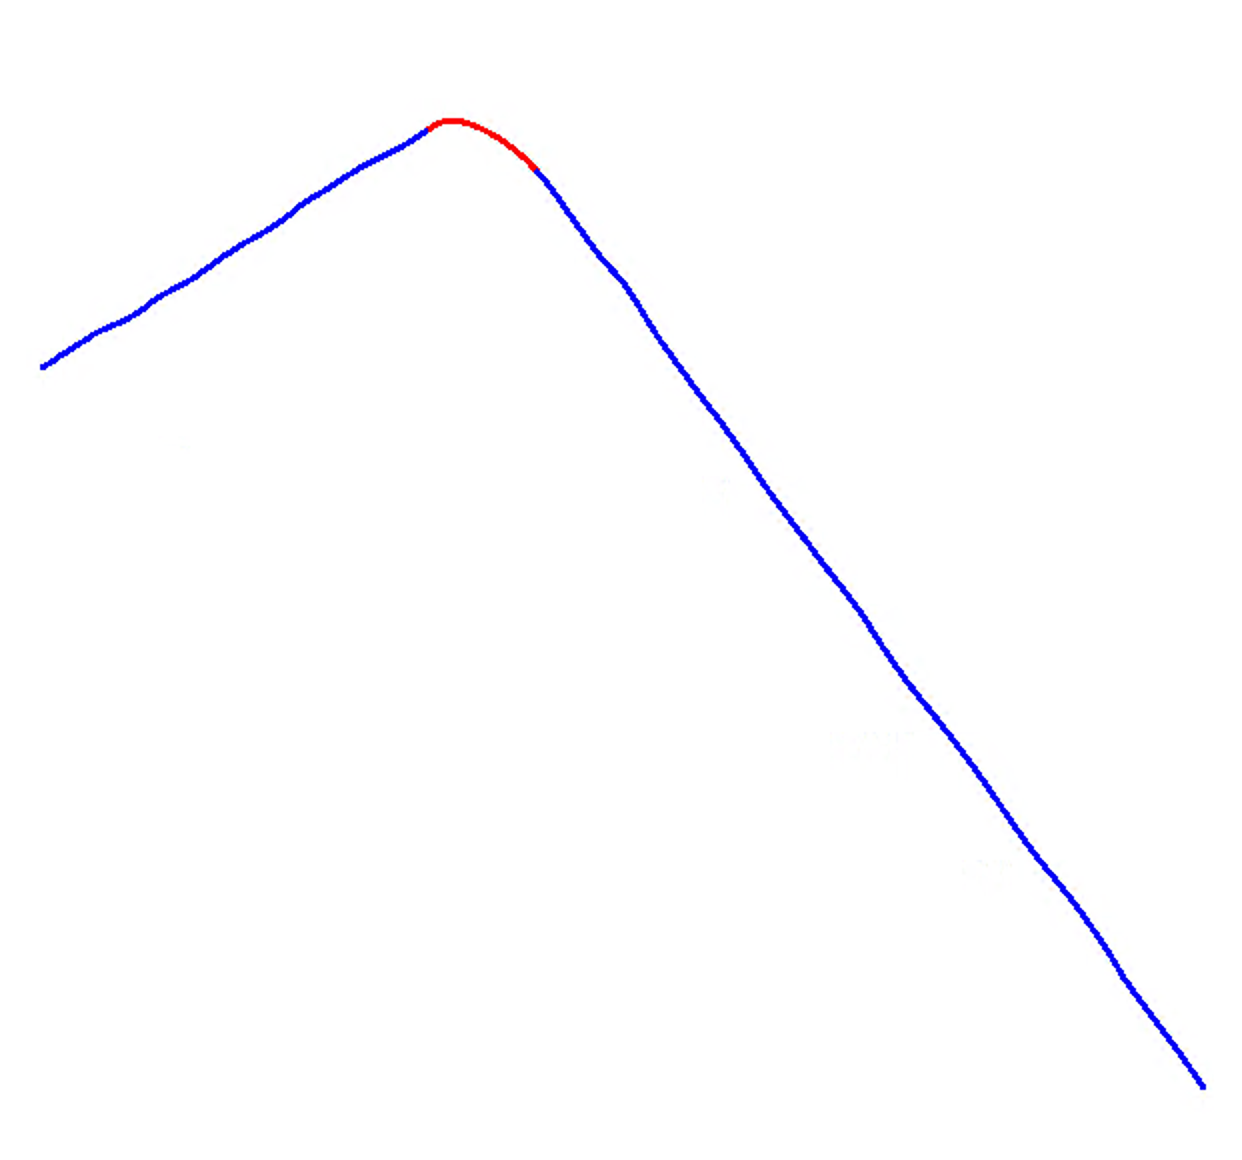
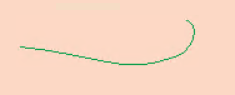
 which look like:
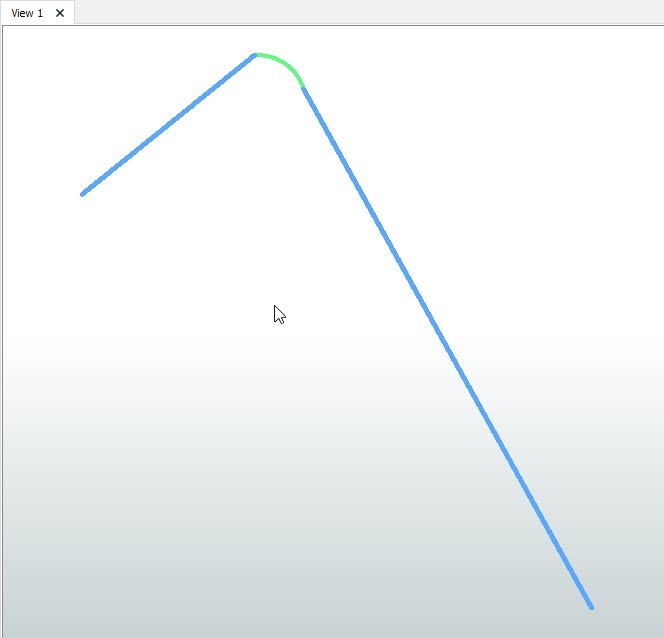 Contact info@safe.com if you want to evaluate the CurveFitter.
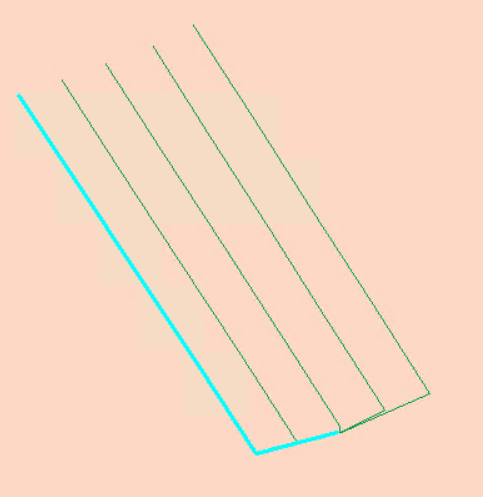
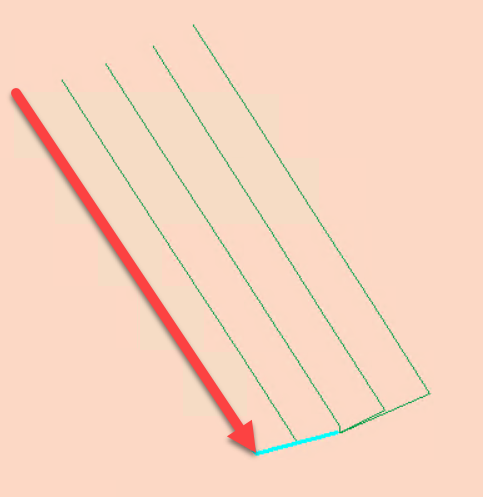

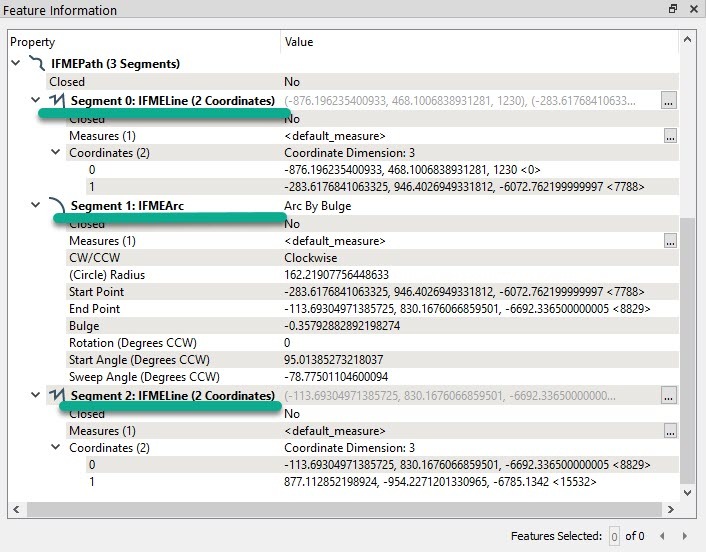
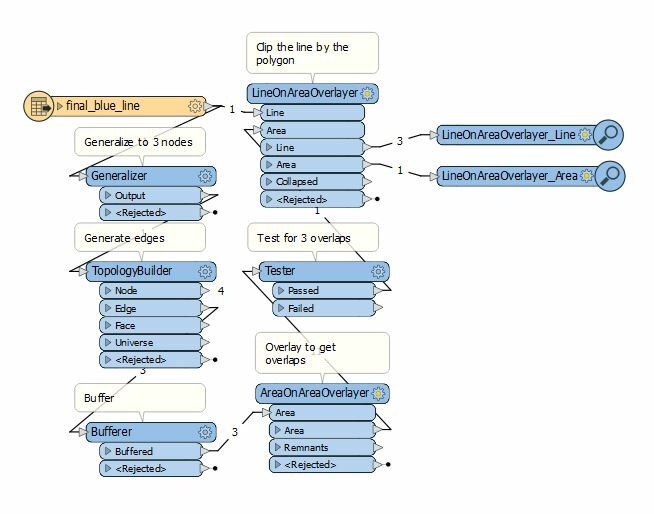
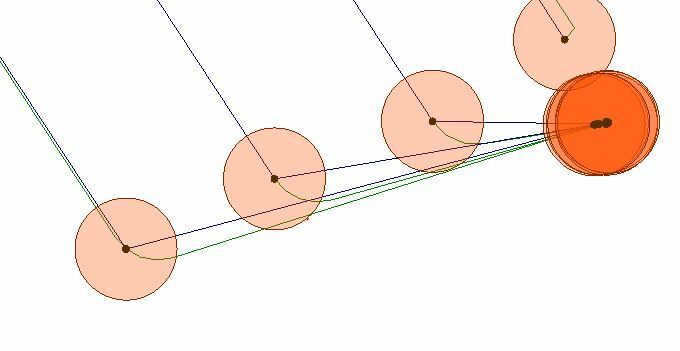
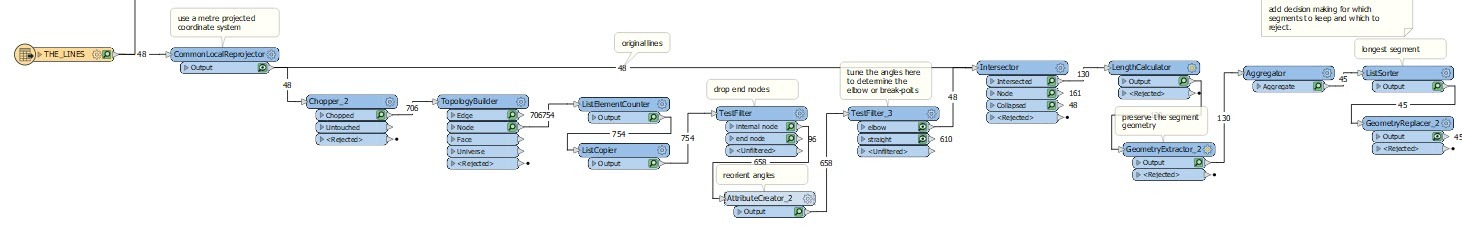 example workspace attached (FME 2020.2)
 From there, anything with 3 overlaps is your polygon used to clip the line.
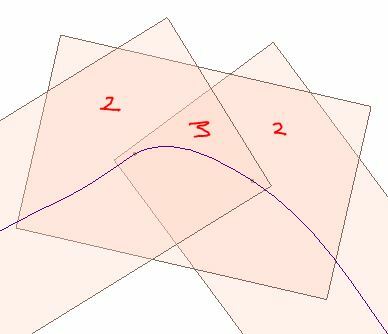
Login to the community
No account yet? Create an account
An FME Account is required to contribute
LoginEnter your E-mail address. We'll send you an e-mail with instructions to reset your password.