Solved

Group lines based on similar heading and of the same attribute type


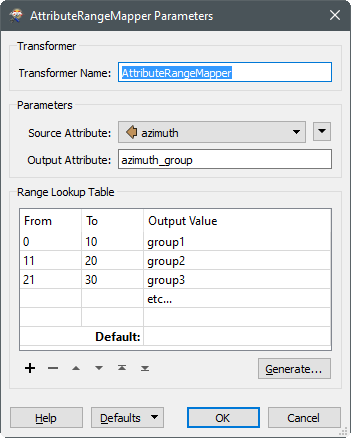
I have a collection of lines and I need to first select those within X distance of each other, and then merge into one feature if the headings are the same (within a specified threshold) and they are of the same type (specified attribute).

The result will be one line representing a grouping of features that are of the same type and heading in roughly the same direction.

Does anyone have any ideas on how to approach this?

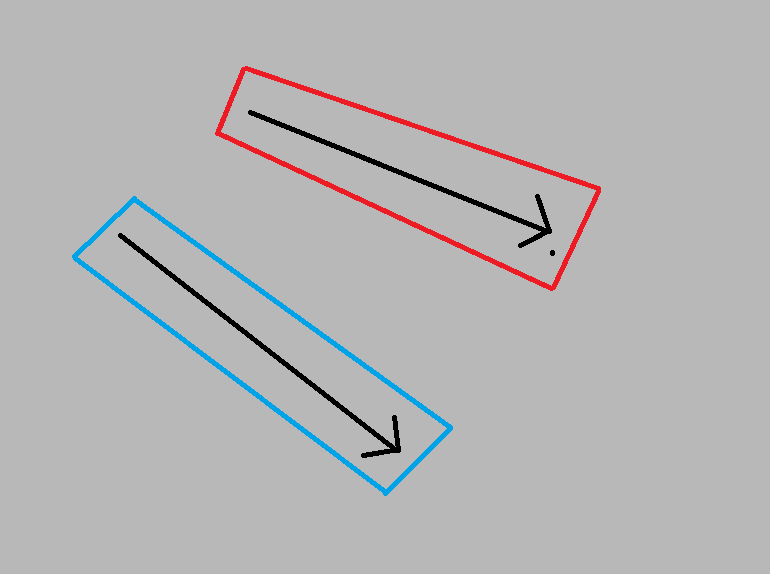
So in the image below, step one would be to find the groupings of lines within x distance and heading in the same direction.

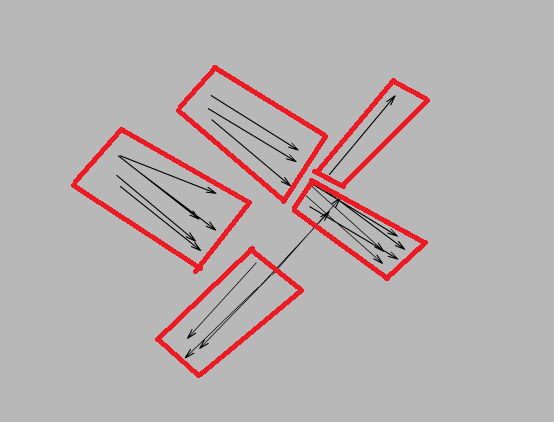
After this selection I want to group them into one feature based on a specific attribute. in the image below, these lines are grouped according to a specified attribute.

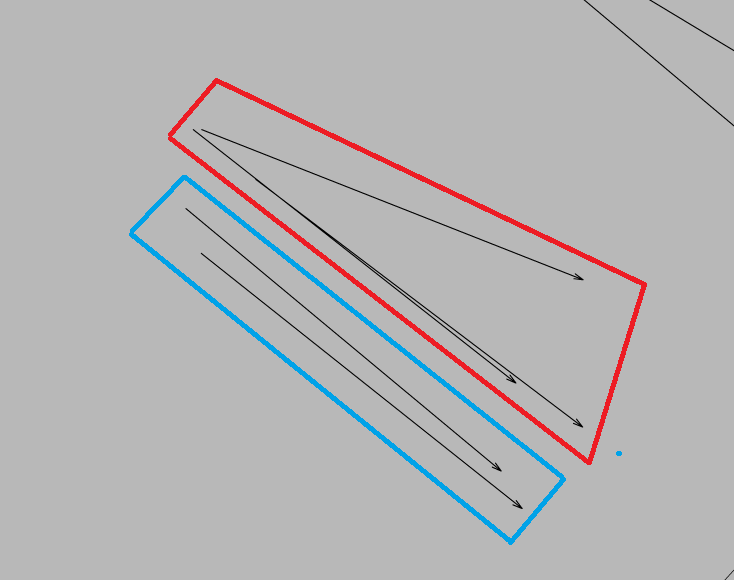
The end result would be this, one line representing all of the merged lines heading in the same direction and grouped by a specific attribute.

Best answer by jdh

I would use the azimuthCalculator (FME Hub custom transformer) to get the heading of each line, the NeighborFinder grouped by your attribute with a maximum distance of X to get a list of the neighboring lines, and then analyse the list to see which of the neighbours have a heading within tolerance.

I would most likely analyse the list in python and output an CollectionID attribute on each feature, so that they can be aggregated, accumulated or however you want to collapse the lines to one, based on that ID.

View original
Did this help you find an answer to your question?

8 replies

jdh
Contributor
Forum|alt.badge.img+28
  • Contributor
  • Best Answer
  • May 11, 2017

I would use the azimuthCalculator (FME Hub custom transformer) to get the heading of each line, the NeighborFinder grouped by your attribute with a maximum distance of X to get a list of the neighboring lines, and then analyse the list to see which of the neighbours have a heading within tolerance.

I would most likely analyse the list in python and output an CollectionID attribute on each feature, so that they can be aggregated, accumulated or however you want to collapse the lines to one, based on that ID.


  • Author
  • May 11, 2017
jdh wrote:

I would use the azimuthCalculator (FME Hub custom transformer) to get the heading of each line, the NeighborFinder grouped by your attribute with a maximum distance of X to get a list of the neighboring lines, and then analyse the list to see which of the neighbours have a heading within tolerance.

I would most likely analyse the list in python and output an CollectionID attribute on each feature, so that they can be aggregated, accumulated or however you want to collapse the lines to one, based on that ID.

Thanks for the solution but my python is not the best.


I have grouped by the attribute in the neighbour finder, but now I am struggling to provide a common ID to the matches in the list. If I understood your answer correctly, I know need to give the matched features the same ID and then I can collapse the lines based on this ID to produce a new line.


(I am new to FME)

david_r
Evangelist
  • May 12, 2017

I agree about using the AzimuthCalculator, but to avoid using Python you could use the AttributeRangeMapper to group the azimuths into blocks with a common ID. For example

So for all your line objects with an azimuth between 11 and 20 they will exit with the attribute "azimuth_group" = "group2", which you can use as your Group By in the NeighborFinder.


jdh
Contributor
Forum|alt.badge.img+28
  • Contributor
  • May 12, 2017
david_r wrote:

I agree about using the AzimuthCalculator, but to avoid using Python you could use the AttributeRangeMapper to group the azimuths into blocks with a common ID. For example

So for all your line objects with an azimuth between 11 and 20 they will exit with the attribute "azimuth_group" = "group2", which you can use as your Group By in the NeighborFinder.

That's definitely a simpler solution, but can leave "orphan" lines, where the cluster is mostly 11,12, and a line that should belong to that cluster is a 10.


david_r
Evangelist
  • May 12, 2017
jdh wrote:
That's definitely a simpler solution, but can leave "orphan" lines, where the cluster is mostly 11,12, and a line that should belong to that cluster is a 10.


Definitely. But that's a challenge you'll also have to deal with when using Python :-)

jdh
Contributor
Forum|alt.badge.img+28
  • Contributor
  • May 12, 2017
david_r wrote:
Definitely. But that's a challenge you'll also have to deal with when using Python :-)
I deal with that by sorting the list by azimuth, and then creating a secondary list of the rolling average histogram of angles within tolerance, and find the peak. Then all the angles within tolerance of the peak, get assigned the same clusterID.


Unfortunately I'm not allowed to share the actual python code that does that.


david_r
Evangelist
  • May 12, 2017
jdh wrote:
I deal with that by sorting the list by azimuth, and then creating a secondary list of the rolling average histogram of angles within tolerance, and find the peak. Then all the angles within tolerance of the peak, get assigned the same clusterID.


Unfortunately I'm not allowed to share the actual python code that does that.


I can understand. Still interesting to hear how you've solved something more or less similar, so thanks for sharing!

ebygomm
Influencer
Forum|alt.badge.img+31
  • Influencer
  • May 15, 2017

Might be worth looking at the list statistics calculor on the FME hub for analysing the list


Cookie policy

We use cookies to enhance and personalize your experience. If you accept you agree to our full cookie policy. Learn more about our cookies.

 
Cookie settings