Hello Guys
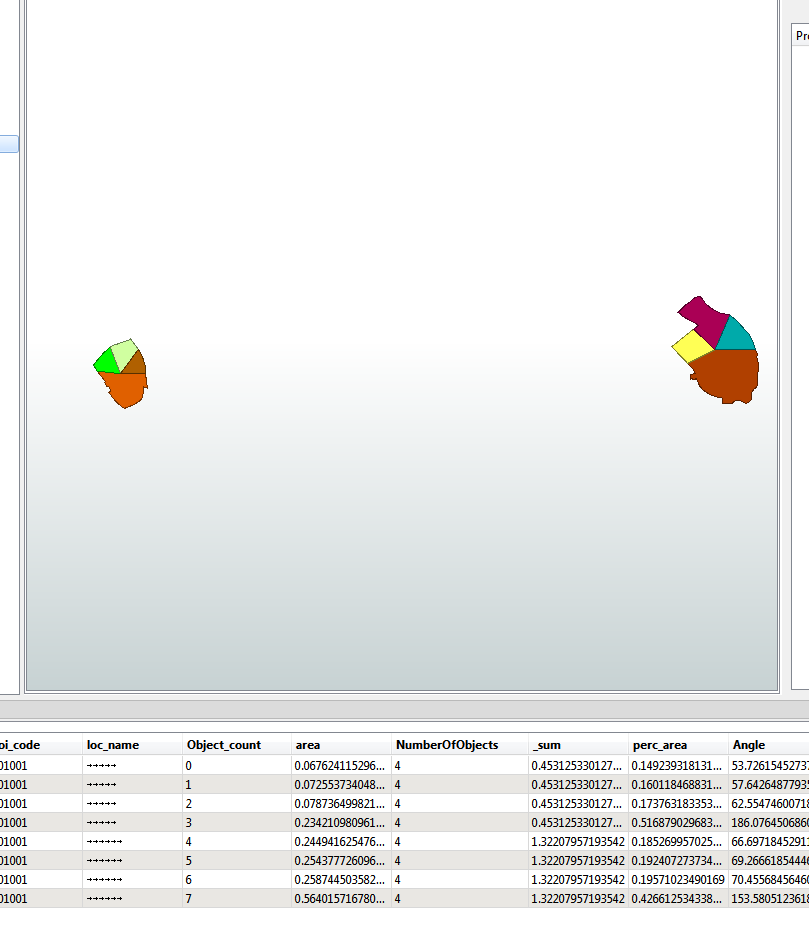
I have shape file with many district and each one have built area and planed area as value but no geometry to differentiate them we only have the district boundary ,is there a way we could have each area colored according to the their value taking the center of the district as center point same as pie chart.
or embed pie chart in the polygon
Thanks