Hi,
Im trying to emulate an Alteryx process, but I dont quite know how to do it.
Here is the video to show a summary of how to do it https://www.youtube.com/watch?v=nmbWf6-PFhE
And here is the test data
<area shape="poly" alt="" coords="496,172, 496,232, 566,232, 566,121, 496,172" href="BLUE">
The process is taking a shape from adobe illustrator, exporting to HTML (as above) then extracting each of the above into a csv that can be read in tableau and produce a shape.
Ideally from this
<area shape="poly" alt="" coords="496,172, 496,232, 566,232, 566,121, 496,172" href="rrrr">
to this
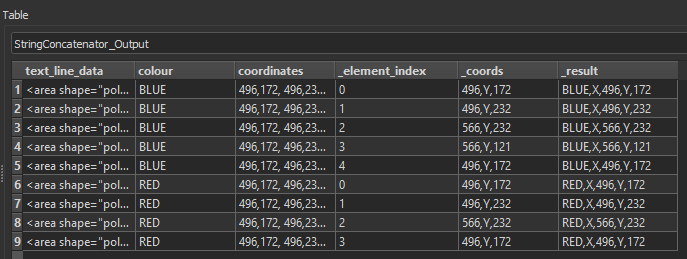
BLUE,X,496,Y,172
BLUE,X,496,Y,232
BLUE,X,566,Y,232
BLUE,X,566,Y,121
BLUE,X,496,Y,172
There maybe multiple variables in the amount of X and Y coordinates per shape.
Anyone got any ideas on how to do this?
Thanks
Chris


