Question

Problem with minimun and maximum value of raster

  • 28 November 2019
  • 5 replies
  • 17 views

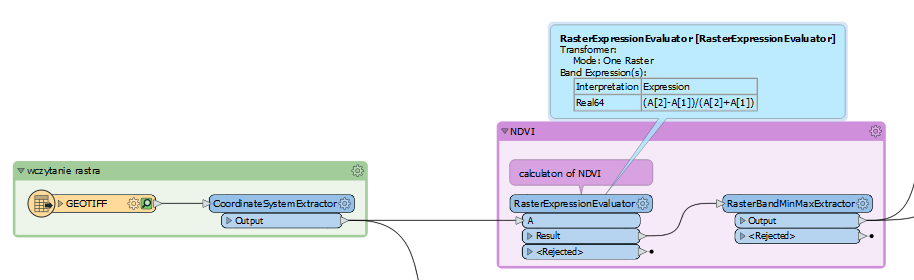
I have a problem with maximum and minimum value of raster. I have a script (on screenshot, and attached) that calculates NDVI.


Firstly I use RasterExpressionEvaluator to count NDVI, and then RasterBandMaxMinExtractor to extract max and min (I need those for further calculation). The maximum and minimum I get are different then maximum and minimum in QGIS for the same raster file.


I checked raster before I run RasterExpressionEvaluator, and minimums, and maximums of bands are the same in FME, and QGIS, so I think the issue might be with the RasterExpressionEvaluator, but I am not sure.


Has anyone has idea how to get this issue right? I need proper max and min value for normalization of NDVI, and I can see that results I get with this max and min value are wrong.


5 replies

Userlevel 2
Badge +17

Hi @marta,

What are the min/max values produced by FME and QGIS, for comparison?

Hi @marta,

What are the min/max values produced by FME and QGIS, for comparison?

Hi @daveatsafe


FME says:


_band{0}.max (string): 0.6461538461538462


_band{0}.min (string): -0.4368932038834951


QGIS says:


Maximum:0.346939


Minimum:-0.283019


The difference is too big, and when I use max/min from FME to normalize (change the range to -1,1) the raster the output is terrible.


Thanks for quick reply!
Userlevel 3
Badge +18

Hi @marta, no idea what your source image is, but as far as i used them before the bands of a three-band CIR color-infrared images are in order: near infrared, red and green. So could it be your expression should be (A[0]-A[1])/(A[0]+A[1])?

And for your interest: there's a NDVI custom transformer in the hub I used before with satisfaction, maybe you could check the results with that transformer too?

Thanks @becchr for answer. I changed the bands, and used this NDVI custom transformer, but still has the same problem. I get raster from FME, and FME says max is about 0.68, min -0.44, and GQIS max about 0.65, and min -0.22


Userlevel 2
Badge +17

Hi @daveatsafe


FME says:


_band{0}.max (string): 0.6461538461538462


_band{0}.min (string): -0.4368932038834951


QGIS says:


Maximum:0.346939


Minimum:-0.283019


The difference is too big, and when I use max/min from FME to normalize (change the range to -1,1) the raster the output is terrible.


Thanks for quick reply!

Hi @marta,

I tested your workspace with a sample image and QGIS 3.4, but was not able to reproduce the problem. Would you be able to share a sample of your source imagery with me? If you don't want to make it public, you can send it to me directly:

Reply