Hello all, very new user here. New to FME, point clouds, LiDAR, and all related.
I'm having an issue where a LiDAR scan I'm attempting to visualize is only displaying correctly when I select 2D in the FME Data Inspector. So when I load the file in to FME, the following is displayed (I've panned and zoomed to make it more obvious what is going on):
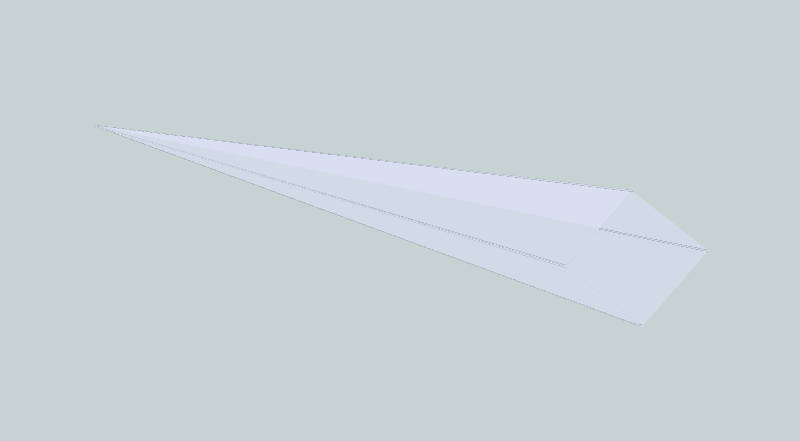
There is nothing but a long thin line even though the inspector recognizes I have loaded > 8 million points. However, when I switch to 2D (the button on the toolbar at the top), the following displays:
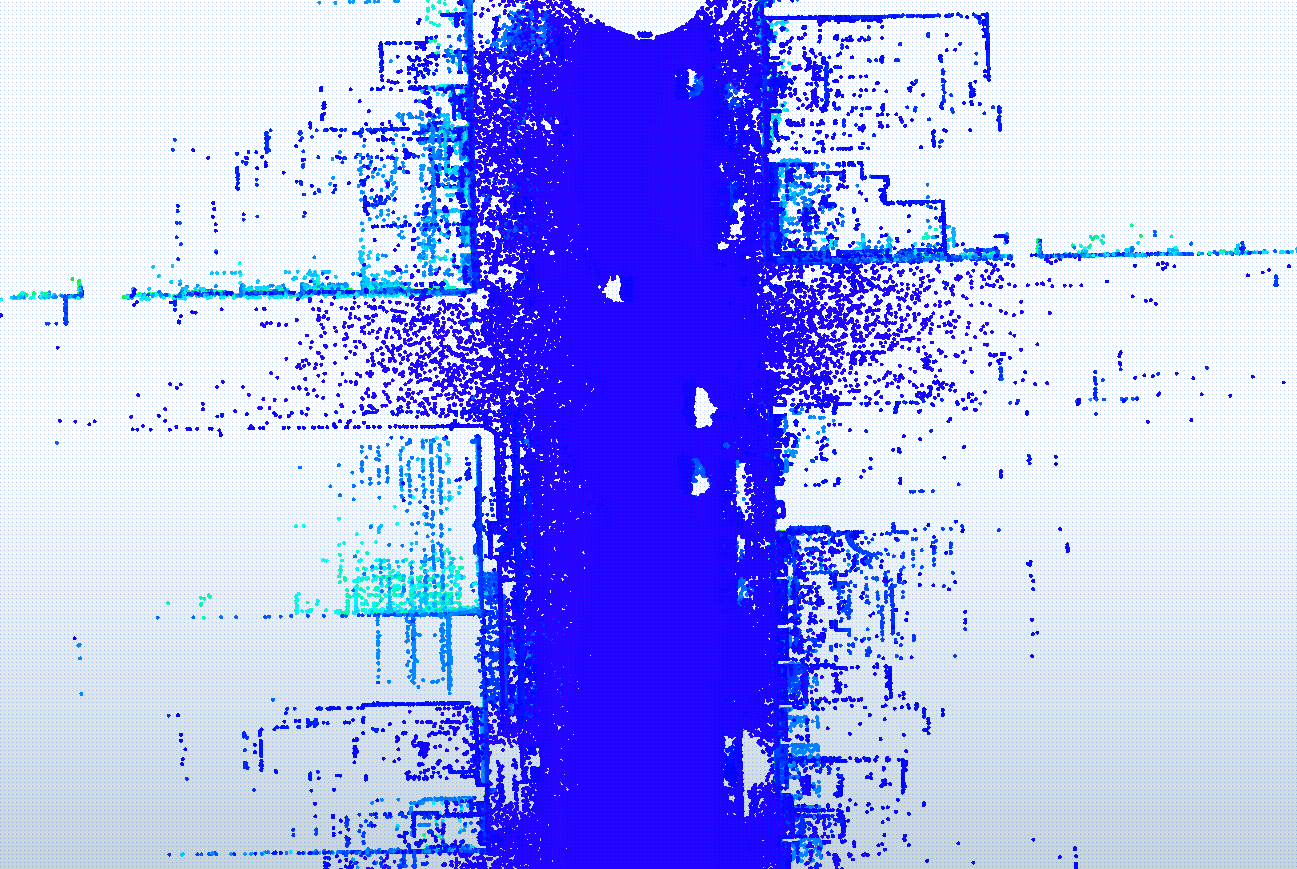
This is in line with what I was expecting, a road with corners and holes in the road where the scanning vehicle passed cars. But again, it only displays like this in 2D.
I understand this is likely a scan format issue. This scan is stored in a polar format based on WGS84, so I attempted to convert it to an XYZ format with a python algorithm a friend suggested to me. At first I thought it had worked, but that one was distorted also. Here is what happened when I loaded that xyz file into Data Inspector:
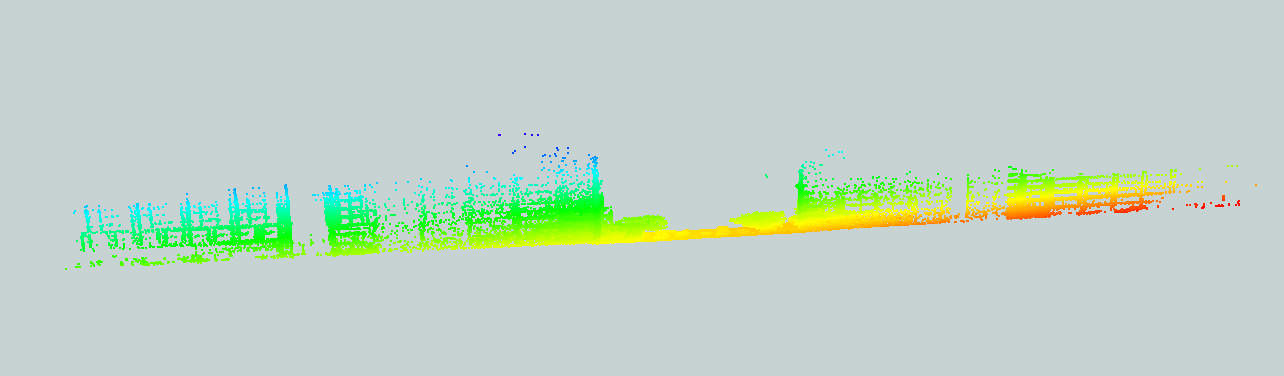
(street from the front)
 (street from the top)
Somewhere in the conversion, the cloud got squished along the dimension of the street. I really am not sure what is going on here or what to make of the results I'm getting. Here is some additional information from the Inspector on both the LAS file and the XYZ file:
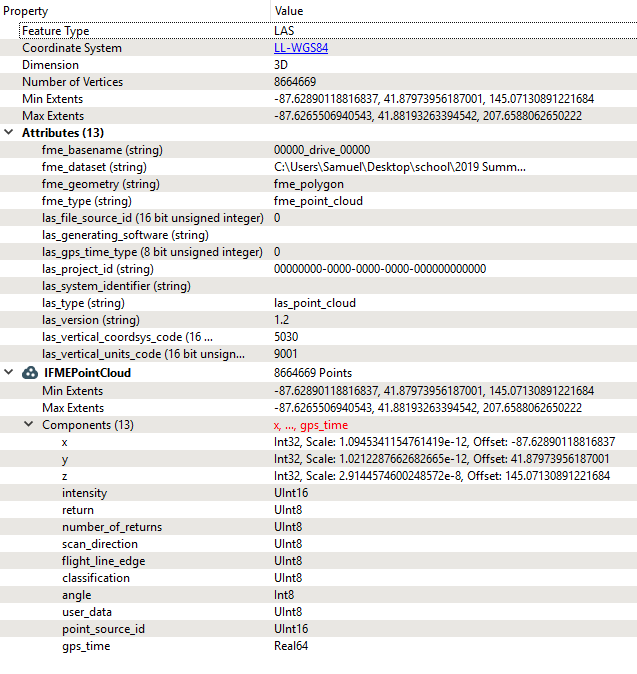
(las)
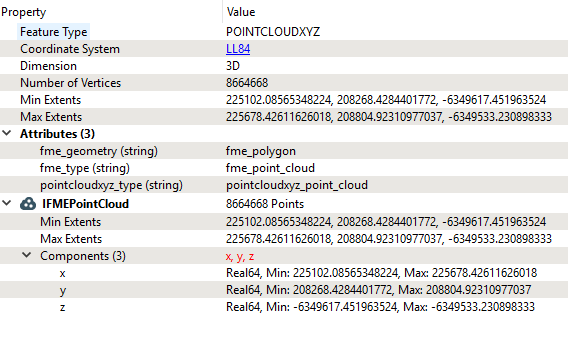
(xyz)
Any help or ideas would be greatly appreciated.