Question

Creating maps with dynamic scale bar

  • 24 April 2017
  • 6 replies
  • 19 views

Hi,

I am new to FME and I try to generate several PDFs with map-content at once.

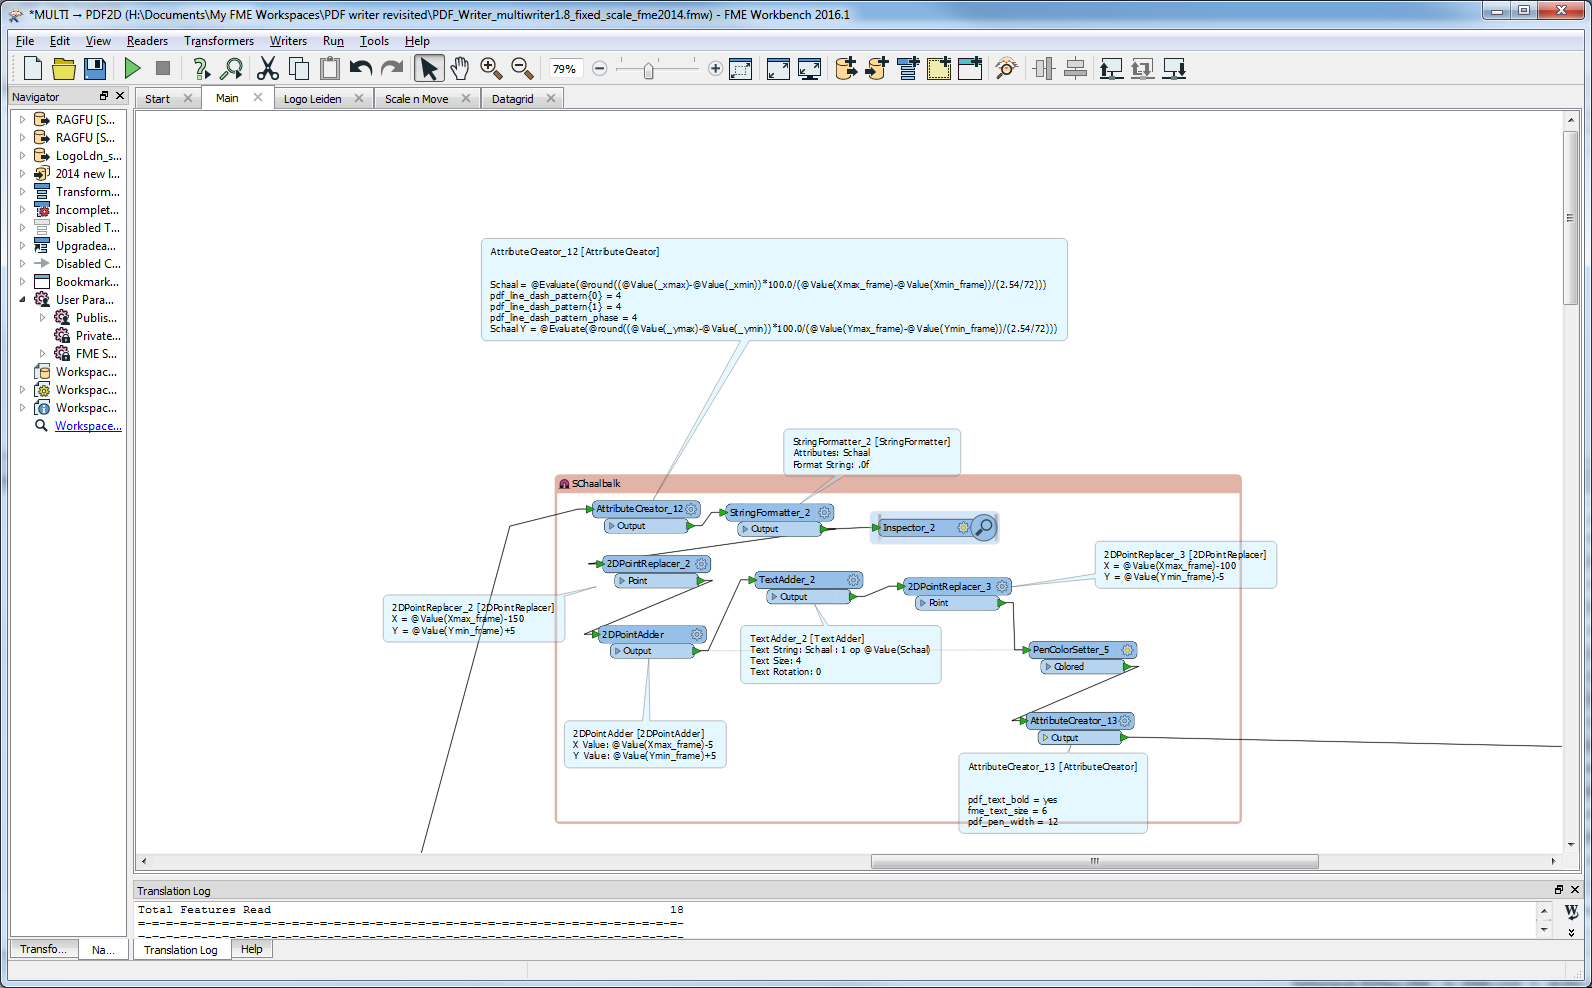
I am struggeling with the creation of a dynamic scale bar.

My Inputdataset is a Shapefile with a lot of polygons I want to iterate through. I need to zoom on every single feature and generate a PDF (for every single feature).

Because of big differences in the size of the features, a static scalebar-Image would be no Option.

Im thinking about a pythonscript to fill a mxd-template and generate the pdf with arcpy.

Is there no fme-way to solve the whole problem without a workaround?

Furthermore it would be great to zoom in steps to even scales.

Thank u very much


6 replies

Badge +3

You can do that by calculating the worldframe (contains the map) vs its content.

Group by ID of objects to get the scale info of each object. Scale is dictated by the bounds of the objects (including maybe some margin) and the frame size.

(see fme readers and writers for these parameters of the pdf writer)

And create a scale bar by creating 2dboxes (or construct them from polylines)

Badge +3

@denisvyver

I looked up the part in a old pdf-creation script of mine.

Here is a pic

schaal = scale (Dutch)

xmax, xmin etc. is extent of bounding box of object, the pdf_world_rectangle including some margins)

xmaxFrame etc. form the calculated (to keep aspect ratio of boundingbox) pdf_frame_rectangle

see pic here

(I used the fme readers and writers pdf section to build these.

Can be found on fme documentation page)

Fme PDFPageFormatter lacks parameter control trough attribute and has no output attributes.

Badge +2

Hi gio,

Is it possible to post a .fmwt for the exemple because I don't understand all the steps of the pics ?

Thanks in advance.

Pierre

Badge +2

You can do that by calculating the worldframe (contains the map) vs its content.

Group by ID of objects to get the scale info of each object. Scale is dictated by the bounds of the objects (including maybe some margin) and the frame size.

(see fme readers and writers for these parameters of the pdf writer)

And create a scale bar by creating 2dboxes (or construct them from polylines)

Hi gio,

Is it possible to post a .fmwt for the exemple because I don't understand all the steps of the pics ?

Thanks in advance.

Pierre

Badge +9

@denisvyver

I looked up the part in a old pdf-creation script of mine.

Here is a pic

schaal = scale (Dutch)

xmax, xmin etc. is extent of bounding box of object, the pdf_world_rectangle including some margins)

xmaxFrame etc. form the calculated (to keep aspect ratio of boundingbox) pdf_frame_rectangle

see pic here

(I used the fme readers and writers pdf section to build these.

Can be found on fme documentation page)

Fme PDFPageFormatter lacks parameter control trough attribute and has no output attributes.

@gio Could you explain what the calculation you had in the attributeCreator? what is the xmax_fame? what is the 72?

I'm assuming you are creating the graphic for the scale using the pdf_dash_line_pattern, but what is the {1} and the {0} mean?

Any chance you can attach your .fmwt?

Badge +3

@tnarladni


Hi,


The script uses the pdf format attributes. And is originaly made in 2014 when we hade no Formatter or styler for pdf.

(of course these still do not offer a scale bar)

pdf_dash_line_pattern is a format attribute ( list attribute ) and can have muiltiple patterns stacked. The patterns are controlled using {0}, {1}...etc.

You can find info on the documentation page https://docs.safe.com/fme/html/FME_Desktop_Documentation/FME_ReadersWriters/pdf2d/pdf2d.htm.

And then https://docs.safe.com/fme/html/FME_Desktop_Documentation/FME_ReadersWriters/pdf2d/Feature_Representation.htm


The 72 in the calculation is 2.54/72 are adobe points. For 1 inches = 72 points


Xmaxframe, Xminframe etc. are xmin, xmax etc for the calculated frame based on the spatial content (Boundsextractor) and margins ( top, bottom, left etc.) including freeing space for a data table, logo etc.

Calculation also keeps/controls the aspect-ratio.


Workspace is prtty big and comments are Dutch. It creates a pdf out of random input data and uses only pdf writers.


As we are in 2019 now, and fme users auto-upgrade along with FME...you can control most using pdfpageformatters and pdfstylers. (pdfformatter needs some serious improvement though..)

If you create a map on a pdf page using a PDFPageFormatter (which is manually of course) you get


example:

pdf_frame_rectangle (string) 121 407 416 618


pdf_world_rectangle (string) 90099.75299999863 459364.3370000012 95920.63399999961 466645.12900000066

AS you can see by the 2 output attributes frame_rect is in adobe points and world in units (meters in this case)

you can use the world and frame rectangles size to calculate your scalevalues and -bars.

Also by using 2 identical pdfformatters you can have the first output the relevant values you need, so you can have the scalevalues and -bars placed by the second formatter.

(this is because there is no attribute or parameter control for the formatter input (..major omission!)

The idea being that the page frame (called frame_rectangle by fme) is in adobe points and the worldrectangle in mapunits (like 1 meter printed on 1 cm pageunit has a scaling of 1/100)


I'll try to translate the Dutch and replace input with "non sensitive" data, have to take some time for that.

Reply