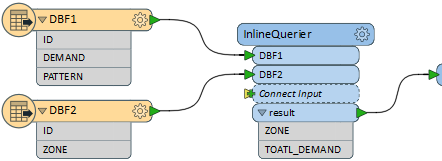
I have data stored across multiple DBF files.
DBF1 contains data stored as follows (sample):
ID ---------DEMAND-------PATTERN
1123-----------5---------------0.3455
3456-----------3---------------0.3212
2322-----------2---------------0.2112
DBF2 contains data stored as follows (sample):
ID----------------ZONE
1123------------ZONE1
3456------------ZONE2
2322------------ZONE1
TOTAL_DEMAND for a particular zone is calculated as the sum of products of the demand and pattern for all the ID that lie within that ZONE.
Ex. for ZONE1(which contains 1123 and 2322), TOTAL_DEMAND= 5*0.3455+2*0.2112
I need to create the final results tabulated as follows:
ZONE-------------TOTAL_DEMAND
ZONE1-----------(calculated as above)
ZONE2-----------(calculated as above)
The task is easier with VLOOKUP in excel, but I am not able to find suitable transformers to do the same in FME. Please suggest a suitable method.
Suggestions regading use of a programming language(such as python) to achieve the same are also welcome.
PS- Hiphens (-) are added just to give clarity about the data arrangement


