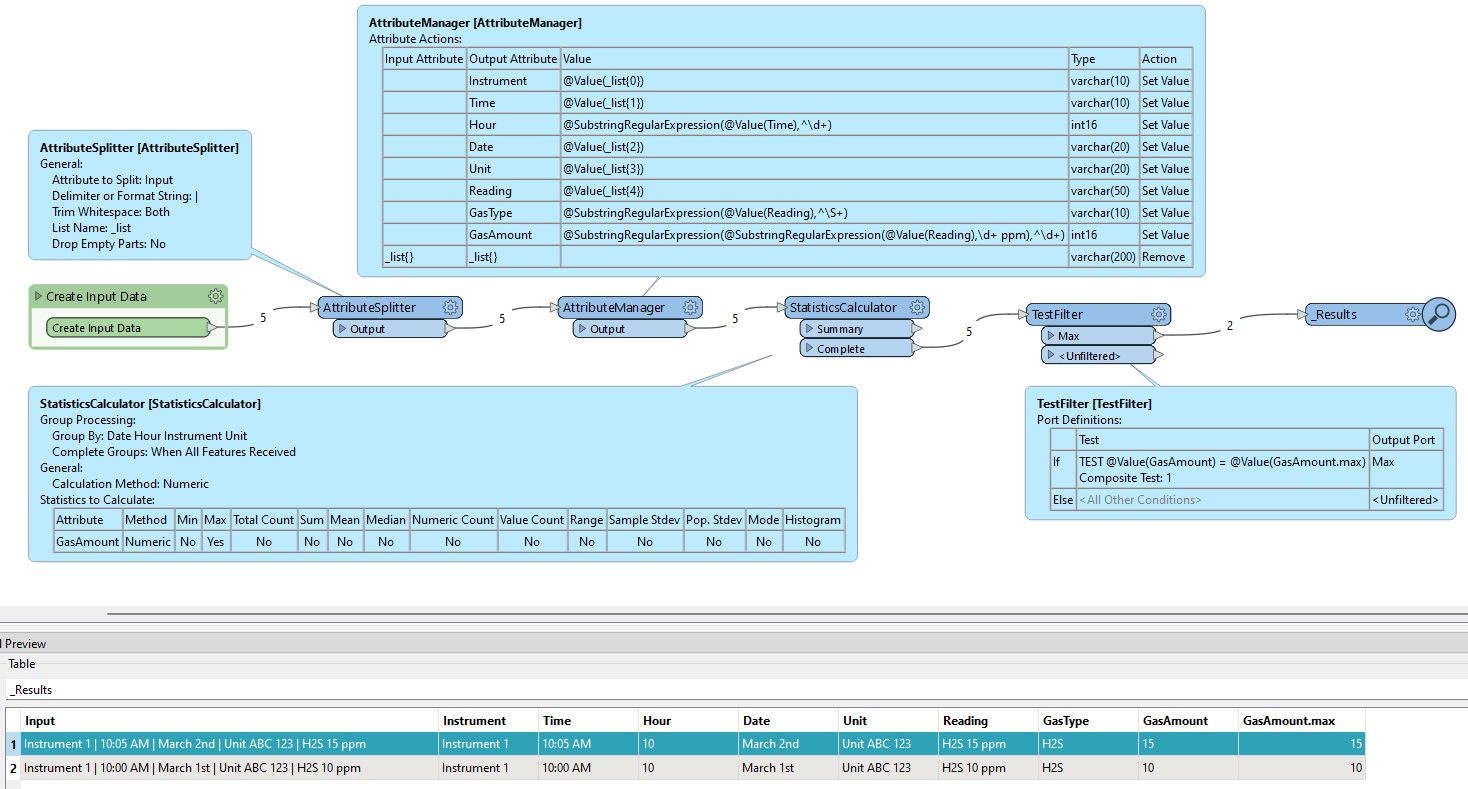
I have data coming in from an instrument. It contains the readings for gasses like oxygen and H2S.
I am trying to create a report to highlight the highest value in a given hour on a given day. With the table below:
Instrument 1 | 10:00 AM | March 1st | Unit ABC 123 | H2S 10 ppm
Instrument 1 | 10:05 AM | March 1st | Unit ABC 123 | H2S 5 ppm
Instrument 1 | 10:10 AM | March 1st | Unit ABC 123 | H2S 0 ppm
...
Instrument 1 | 10:00 AM | March 2nd | Unit ABC 123 | H2S 10 ppm
Instrument 1 | 10:05 AM | March 2nd | Unit ABC 123 | H2S 15 ppm
...
I would want the report to show me the following,
Instrument 1 | 10:05 AM | March 2nd | Unit ABC 123 | H2S 15 ppm
Instrument 1 | 10:00 AM | March 1st | Unit ABC 123 | H2S 10 ppm
because those values are the highest gas reading for each hour, (10 AM as a record, 11 AM as another etc) on each unique day.
I have tried the statistics calculator, but it doesn't allow you to accumulate the other attributes, or allow you to find unique fields to 're-merge' the data together. I am suspect that it is returning the expected data.
Am I missing an obvious transformer to use here?


