I would approach it in the following way :
- Ad a counter to the plots
- ad an areaCalculator to the plots
- Clipper to cut out the forests to each plot, whilst transferring the count and area (plots) attribute to the forests.
- Run an areaCalculator on the forests grouped by count (plot)
- StatisticsCalculator to calculate the percentage, grouped by count (plot)
If you have an initial identifier for the plots you would probably want to transfer that as well to the forest in the clipper.
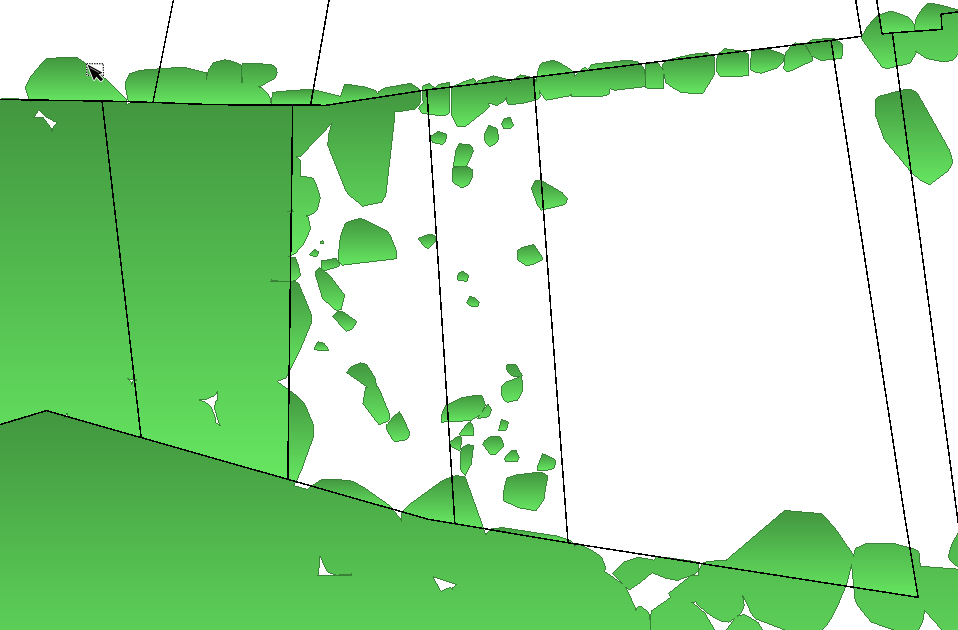
Hi @aron thanks for answer. I forgot to say that the plots have already an ObjectID and the surface calculated. When I Made the clip with the forest layer as candidate and plots as clipper, I get actually many different entities (polygones) with the same Identifier as you see in the image below
I would have expected that within a parcel there would be only one entity.
And then, I didn't understood how to calculate the percentage. In the StatisticsCalculator i didn't find how to do it.
Every group of trees within the plot gets the same id. The plot on the far left of your image would have only one "forest", while the one in the middle would have 10+.
At second thought I would use an AreaCalculator on the plot and another one for the forest, it is important that this one is grouped by id. Then use an AtributeCalculator to calculate the coverage. Give the attribute a new name and use the aritmethric calculator to get the percentage. Plotarea/forestarea.