Solved

Mapping Transmission Lines Data Flow using Values in Two Columns


Badge +1

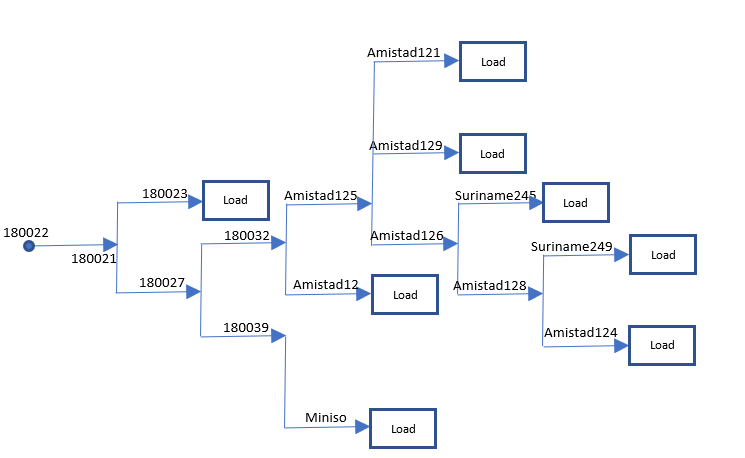
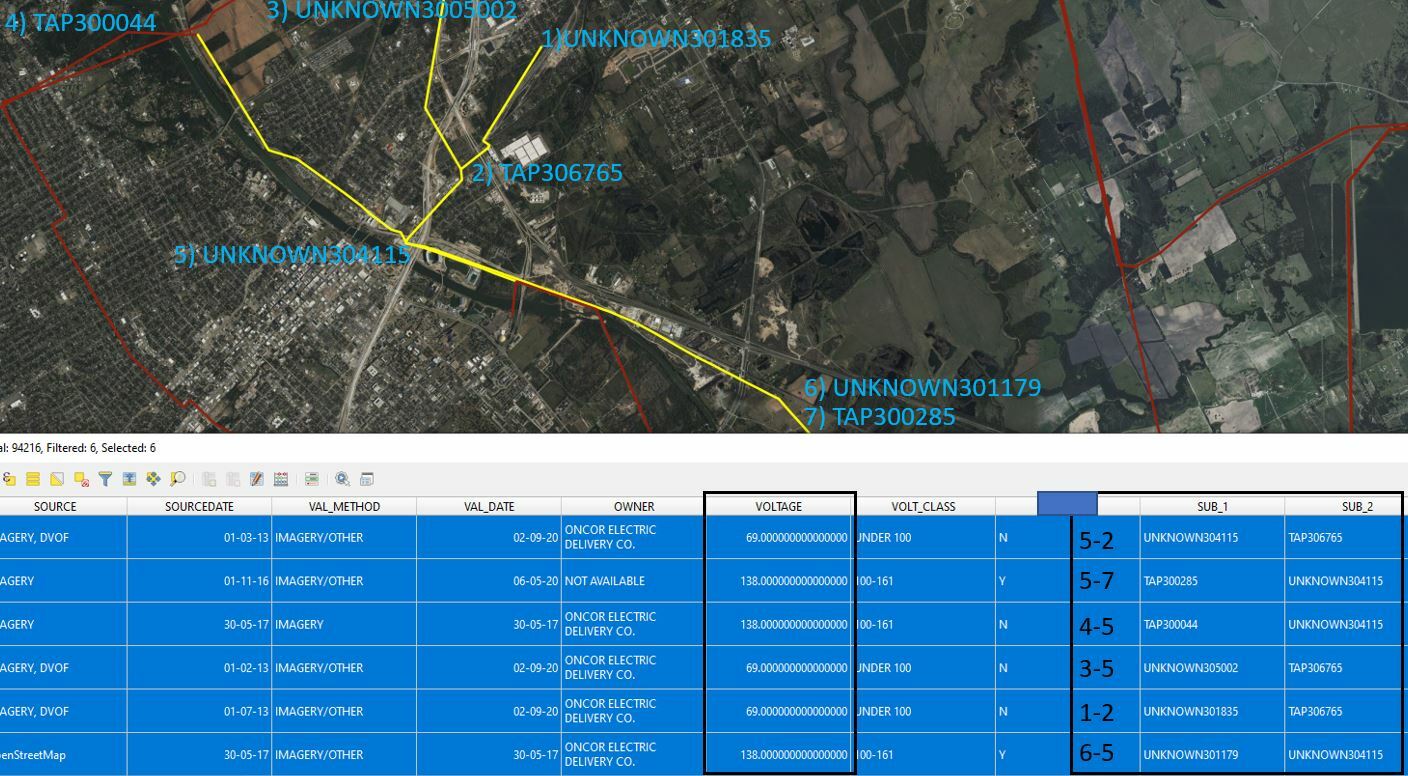
I hope this message finds you well. I am reaching out to the FME community to ask for suggestions on how to map transmission lines data using sub1 and sub2 columns. Our goal is to find the node mapping between transmission lines and substations, and we have the necessary data in these two columns.

I have been working with FME for a while now, but I am not sure about the best way to approach this mapping task. Any advice, tips, or best practices you could share would be greatly appreciated.

Attached the piece of data for understanding.

Thank you in advance for your time and expertise. I look forward to hearing from you soon!


icon

Best answer by markatsafe 8 February 2023, 23:54

View original

12 replies

Badge +2

@parashari​ Thanks very much for including some sample data. A picture is worth a thousand words and sample data is worth a thousand pictures!

Can you expand a little on what the SUB_1/2 columns represent and what nodes you want. For example for line ID 124974 SUB_1=WAPELLO SUB_2=OTTUMWA GENERATION STATION - what would be the expected output? Thx

Badge +22

To get the nodes from the data you can use the TopologyBuilder. If you enable the Generate List From Input Edges you can get a list of the SUB_1, SUB_2 values for each node.

If the lines are properly oriented then you can tell whether a line is incoming or outgoing (based on positive or negative arc_id value) and then pick the corresponding sub for that node.

If the lines are not properly oriented you can use the listAppender (FME Hub) to create a combined list of sub_1, sub_2 and then a listHistogrammer on that combined list. The value with the highest count is the SUB for that node.

Badge +1

@parashari​ Thanks very much for including some sample data. A picture is worth a thousand words and sample data is worth a thousand pictures!

Can you expand a little on what the SUB_1/2 columns represent and what nodes you want. For example for line ID 124974 SUB_1=WAPELLO SUB_2=OTTUMWA GENERATION STATION - what would be the expected output? Thx

Hey @Mark Stoakes​ Thank you for your response.

I am working on electrical transmission lines for Texas region. The lines are connected to each other from generating power plant till the end use(load) with substations and nodes/buses in between that manage and maintain electrical voltage. Nodes and substations also manage the electric distribution and congestion in the voltage lines.

Here, I am trying to find the connectivity of buses from generating station till it reaches the load. The catch is, in attribute information there are two columns sub1(from) and sub2(to) that describe spatially how and where the lines are connected on the map. Using the voltage information and sub1 and sub2, I am trying to create the flow of current.

I am expecting an output that selects the flow of electrical lines from generator to load using sub1, sub2 and voltage information. Ultimately, I have to perform this activity in excel data itself with using geospatial information, but that comes to the later stage.

Thank you.

ProcessFlow

Badge +1

To get the nodes from the data you can use the TopologyBuilder. If you enable the Generate List From Input Edges you can get a list of the SUB_1, SUB_2 values for each node.

If the lines are properly oriented then you can tell whether a line is incoming or outgoing (based on positive or negative arc_id value) and then pick the corresponding sub for that node.

If the lines are not properly oriented you can use the listAppender (FME Hub) to create a combined list of sub_1, sub_2 and then a listHistogrammer on that combined list. The value with the highest count is the SUB for that node.

@jdh​  Thank you for having a look at it.

TopologyBuilder provides the data correct, however it creates a node at each intersection spatially. Can we take the voltage, SUB_1 and SUB_2 data using the tabular format and take out spatial data that represent generator to load flow of electricity? I have mentioned a description on what I am looking for.

Thank you.

Badge +22

@jdh​  Thank you for having a look at it.

TopologyBuilder provides the data correct, however it creates a node at each intersection spatially. Can we take the voltage, SUB_1 and SUB_2 data using the tabular format and take out spatial data that represent generator to load flow of electricity? I have mentioned a description on what I am looking for.

Thank you.

I'm not entirely sure what you want as output. The list of substations from a generator to a load? The set of lines from the generator to a load? A list of all possible paths from all generators to all loads?

Badge +1

@jdh​  Thank you for having a look at it.

TopologyBuilder provides the data correct, however it creates a node at each intersection spatially. Can we take the voltage, SUB_1 and SUB_2 data using the tabular format and take out spatial data that represent generator to load flow of electricity? I have mentioned a description on what I am looking for.

Thank you.

@jdh​ So, if I select one transmission line, the whole connected line (using SUB_1 and SUB2) to be selected as a snake from the generating source to the load.

You are right by saying 'set of lines from generator to load'. But by using attribute info in voltage, sub1 and sub2 columns as it contains electrical distribution network information.

Thanks once again.

Badge +22

@jdh​  Thank you for having a look at it.

TopologyBuilder provides the data correct, however it creates a node at each intersection spatially. Can we take the voltage, SUB_1 and SUB_2 data using the tabular format and take out spatial data that represent generator to load flow of electricity? I have mentioned a description on what I am looking for.

Thank you.

As pure FME, I would consider the ShortestPathFinder.

Personally, I would drop into python and set up a depth first search, as you essentially have a graph data structure.

It should also be possible to do this in SQL.

Badge +2

Hey @Mark Stoakes​ Thank you for your response.

I am working on electrical transmission lines for Texas region. The lines are connected to each other from generating power plant till the end use(load) with substations and nodes/buses in between that manage and maintain electrical voltage. Nodes and substations also manage the electric distribution and congestion in the voltage lines.

Here, I am trying to find the connectivity of buses from generating station till it reaches the load. The catch is, in attribute information there are two columns sub1(from) and sub2(to) that describe spatially how and where the lines are connected on the map. Using the voltage information and sub1 and sub2, I am trying to create the flow of current.

I am expecting an output that selects the flow of electrical lines from generator to load using sub1, sub2 and voltage information. Ultimately, I have to perform this activity in excel data itself with using geospatial information, but that comes to the later stage.

Thank you.

ProcessFlow

@parashari​  In the example above - how do you know ID 180022 starts at a generation station , 

ID   SUB_1   SUB_2
180022  UNKNOWN132115   UNKNOWN177233        

and which end is the generating station?  Similarly, how do you identify Amistad124 (which does not exist in the data) terminates in a LOAD?

As I understand it you want a path from 180022 to Amista124, a path from 180022 to Suriname245 and so on, is that correct?  

Badge +1

Hey @Mark Stoakes​ Thank you for your response.

I am working on electrical transmission lines for Texas region. The lines are connected to each other from generating power plant till the end use(load) with substations and nodes/buses in between that manage and maintain electrical voltage. Nodes and substations also manage the electric distribution and congestion in the voltage lines.

Here, I am trying to find the connectivity of buses from generating station till it reaches the load. The catch is, in attribute information there are two columns sub1(from) and sub2(to) that describe spatially how and where the lines are connected on the map. Using the voltage information and sub1 and sub2, I am trying to create the flow of current.

I am expecting an output that selects the flow of electrical lines from generator to load using sub1, sub2 and voltage information. Ultimately, I have to perform this activity in excel data itself with using geospatial information, but that comes to the later stage.

Thank you.

ProcessFlow

Hey @Mark Stoakes​ Allow me to share an example with real figures.

If we take the case in below image, I have added numbers SUB1 and SUB2 to the imagery as the flow of electricity. Each endpoint is added with a number and is connected to the second one. Also added the flow in attribute table to the left of SUB_1 column (highlighted in black).

If we closely look at the data, column, Voltage plays a role here as the endpoints 1,2, 5 are 68 kV, whereas 4,5,6,7 are 138kV.

What I am looking for here is to select the complete transmission line with values in SUB_1 and SUB_2 with the same voltage level flow.

Please have a look at the data below, it is near 31.5551230,-97.1034693:

Thank you.TransLines

Badge +1

@jdh​  Thank you for having a look at it.

TopologyBuilder provides the data correct, however it creates a node at each intersection spatially. Can we take the voltage, SUB_1 and SUB_2 data using the tabular format and take out spatial data that represent generator to load flow of electricity? I have mentioned a description on what I am looking for.

Thank you.

@jdh​ Thank you for pitching in your idea.

I am not not much into python programming, though I tried the SPF transformer. The to-from attributes are selecting hanging lines as path. I did good research on this and a few more corresponding transformers if it can be useful here, but couldn't get through. I still believe there would be some possibility in FME.

I will update here if I get something. :)

Badge +2

@parashari​ Thanks for including the image (above) and the additional description. I'm still not 100% clear on how the SUB_1/2 are to be used in the network. But I think the NetworkTopologyCalculator might give you the results you need IF the data is accurate and well conditioned - i.e. all the transmission lines vertices connect where they should. I don't think this is the case with the data you provided.

Based on you image and description, I think if you used NetworkTopologyCalculator and Group By the Voltage you might get close to what you need. Example attached (FME 2022.1) (source SHAPE data is above)

If you only want a network where SUB_1/2 also match you're probably looking at a python script as @jdh​  suggests

Badge +1

@parashari​ Thanks for including the image (above) and the additional description. I'm still not 100% clear on how the SUB_1/2 are to be used in the network. But I think the NetworkTopologyCalculator might give you the results you need IF the data is accurate and well conditioned - i.e. all the transmission lines vertices connect where they should. I don't think this is the case with the data you provided.

Based on you image and description, I think if you used NetworkTopologyCalculator and Group By the Voltage you might get close to what you need. Example attached (FME 2022.1) (source SHAPE data is above)

If you only want a network where SUB_1/2 also match you're probably looking at a python script as @jdh​  suggests

@Mark Stoakes​ Simple and precised. That is what I wanted.

Thank you Mark and @jdh​ for your responses.

Reply