
Hi everyone,
I just started out using FME Desktop for my job. I am trying to find out how it would be possible to use group by based on a combination of attributes. The example is just something I thought of, so not based on real data. Initially, the source data in this imaginary case would just have an overview of all the shops. First, I would like to have an overview of the amount of shops per mall. So first I have to group by based on which mall the shop does belong to. Thereafter I would like to group by based on what type of shop it is. E.g. Clothing store, ~department store etc. So for example from the 100 shops that belong to mall A 10 are clothing stores for example , 4 restaurants e.g. i tried it with the StatisticsCalculator, however when I put put all these attributes in the group by field, I don't get the result below. Instead of grouping first on the type of mall and thereafter looking at the type of shop, all attributes are considered in the grouping equally. So I got more rows. Does anyone know how I can get below result.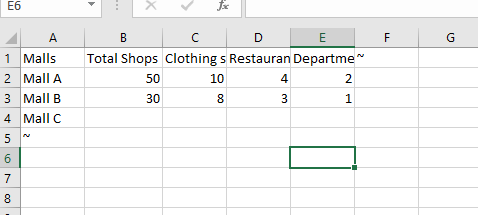


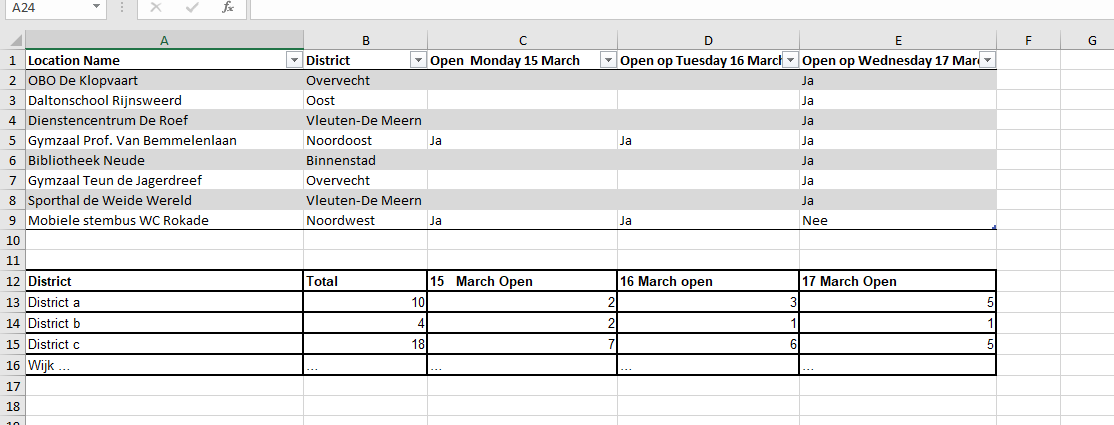
 send that to a StatisticsCalculator with GroupBy District, Total Count on Location to get all the station in each district, and Sum on Open 15, Open 16 and Open 17 (we transformed every Ja to a 1 so we can sum😀 ).
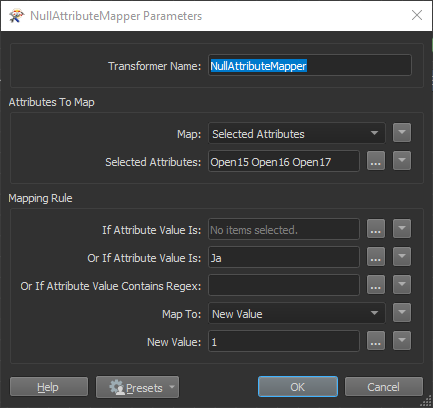
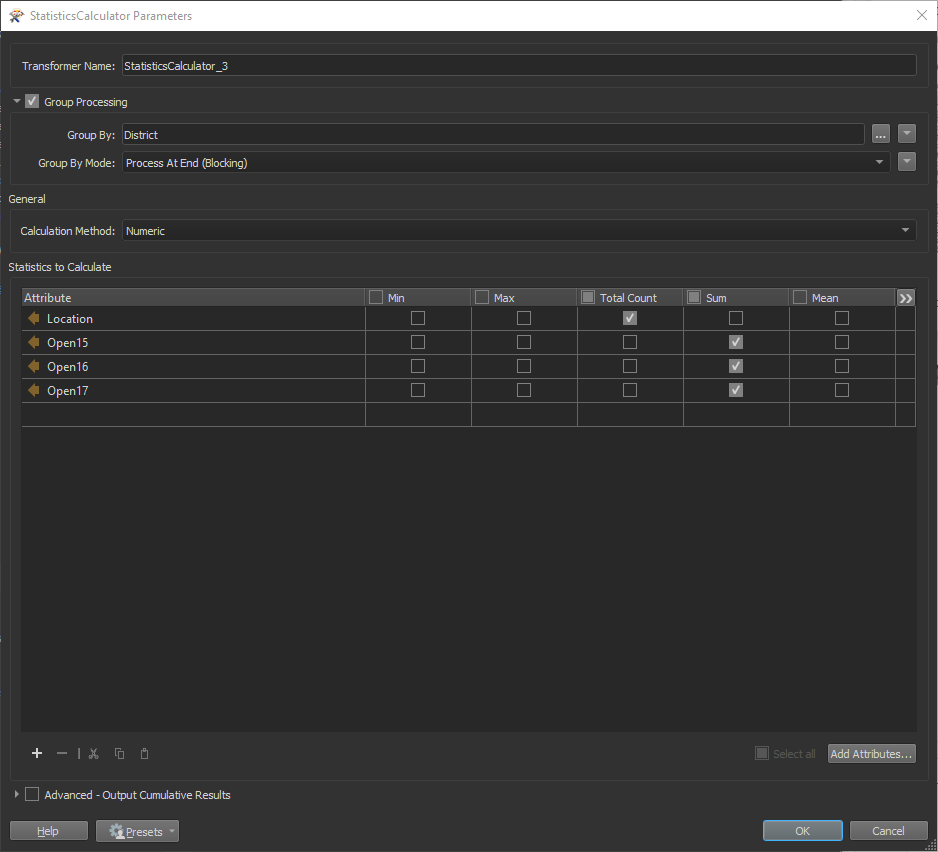 This is just one solution, I like working with numbers and it avoids not NULL attributes (like Nee in just the Open 17 column as opposed to empty cells in 15 and 16).