Best answer by jdh
View original
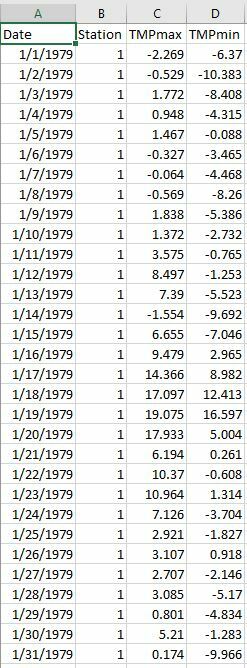
I have filtered air temp into average daily max and min. And I would like to display them in two columns filtered by date and station. In the final table, only the max temp is showing in both columns. How do I show min temp as well?
I have filtered air temp into average daily max and min. And I would like to display them in two columns filtered by date and station. In the final table, only the max temp is showing in both columns. How do I show min temp as well?


Userlevel 4
 +30
+30
- Evangelist
- 1880 replies
-
13 March 2021

Hi @robeesafe
please, could you share the data?


 +22
+22
- Contributor
- 1961 replies
-
15 March 2021

We would need to know the settings on your workspace to be able to help.
Hi @robeesafe
please, could you share the data?
We would need to know the settings on your workspace to be able to help.
+22
- Contributor
- 1961 replies
-
15 March 2021
Hello JDH,
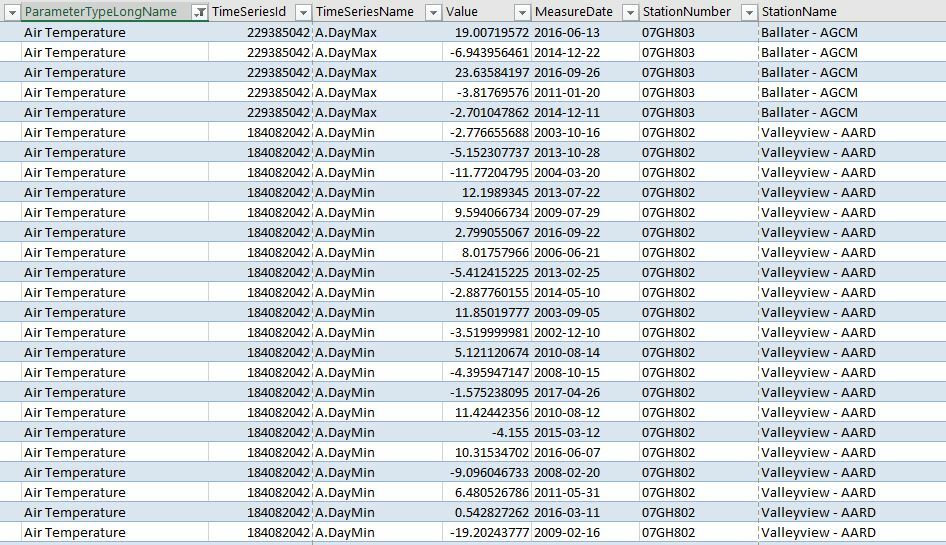
I have attached the weather dataset from which I would like to filter the "Air Temperature" out of "ParameterTypeLongName" and further filter A.DayMax and A.DayMin from "TimeSeriesName" to display as indicated in "tmp.csv".
Here is an image of the transformers I used:
[cid:image001.png@01D71981.4FD5DB90]
Let me know if you have any questions.
Thanks,
Robert
Classification: Protected A
Hi Robert,
I'm not seeing either the image or the attached csv.
Hello JDH,
I have attached the weather dataset from which I would like to filter the "Air Temperature" out of "ParameterTypeLongName" and further filter A.DayMax and A.DayMin from "TimeSeriesName" to display as indicated in "tmp.csv".
Here is an image of the transformers I used:
[cid:image001.png@01D71981.4FD5DB90]
Let me know if you have any questions.
Thanks,
Robert
Classification: Protected A
Hi @robeesafe
please, could you share the data?
We would need to know the settings on your workspace to be able to help.
+22
- Contributor
- 1961 replies
-
18 March 2021
Hello JDH,
Do you have any update for me?
Thanks,
Robert
Classification: Protected A
Hi Robert, I am not sure how you are sending the attachments, but they are not showing up in this forum.
Hello JDH,
Do you have any update for me?
Thanks,
Robert
Classification: Protected A
+22
- Contributor
- 1961 replies
-
18 March 2021
Hello JDH,
Do you have any update for me?
Thanks,
Robert
Classification: Protected A
Use the web interface. You can embed images and attach a file to your reply.
Here is one of the attachments. How do I send an Excel and csv file?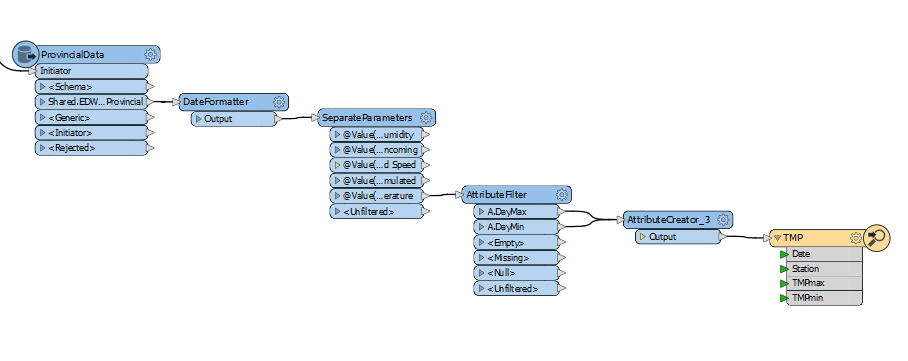
 +22
+22
- Contributor
- 1961 replies
-
18 March 2021
- Best Answer
OK. It looks like what you want to do is after your Feature Reader have a tester for ParameterTypeLongName = Air Temperature, then your DateFormater (this is a performance thing, why format dates that you are not going to use)
Then an attributeCreator @Value(TimeSeriesName) = @Value(Value). This should give an attribute of either A.DayMax or A.DayMin depending on which row/feature it is.
Then an Aggregator with a group by on StationName and MeasureDate, in Accumulation Mode Merge Incoming Attributes
That will get both the max and min temp attributes on the same feature. You can then do any cleanup of attribute names (this may require an attributeExposer).
Thanks, your solution worked.
Reply
Enter your username or e-mail address. We'll send you an e-mail with instructions to reset your password.