Solved

Perform zonal statics with the Rcaller

  • 9 September 2018
  • 6 replies
  • 15 views

Hi,

I try to use the Rcaller in FME to perform zonal statistics. My input is a shapefile and a Geotiff, however i read that the Rcaller reads it as a dataframe when imported into R. I tried to convert it in the Rcaller back to a shapefile and raster (with rasterFromXYZ('dataframe) and SpatialPointsDataFrame() ), but i got a error that the X and Y coordinates are missing and I cannot figure out how to include them?

In R would normaly perform a zonal statistics in the following way:

setwd('location\\files)

library(raster)


library(rgdal)


shape <- readOGR(dsn = "Shapefile.shp")


DEM <- raster("Elevation")#extract raster cell count (sum) within each polygon area


ex <- extract(DEM, shape, fun=sum, na.rm=TRUE, df=TRUE)


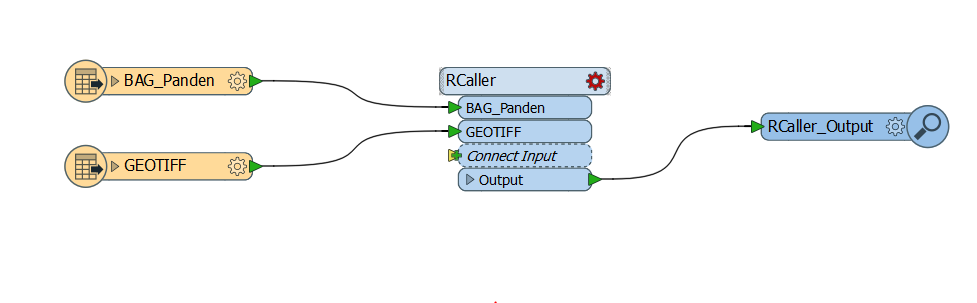
My FME canvas looks at following:

Can somebody help me with an example or url reference to one?

Thanks for considering my request!

icon

Best answer by markatsafe 10 September 2018, 18:37

View original

6 replies

Badge +2

@zpieter You can't load a raster/image directly into the RCaller data frame. You have to read your raster directly in your R script. It would be similar to writing a raster, as illustrated in this kriging example. Alternatively, you could covert your raster to points using RasterCellCoercer / RasterToPointCoercer, but this could be pretty slow depending on the size of your raster

@MarkAtSafe thank you for your answer! So that means that it is possible to import a shapefile into the Rcaller? And would it be possible to import raster files in the future?

And what about the Python Caller. Would it be possible to load a raster file into Python Caller to perform zonal statistics? Or is there another way to perform a relative fast zonal statistics (for about 500.000 features) in FME?

Kind regrards,

Pieter

Badge +2

@MarkAtSafe thank you for your answer! So that means that it is possible to import a shapefile into the Rcaller? And would it be possible to import raster files in the future?

And what about the Python Caller. Would it be possible to load a raster file into Python Caller to perform zonal statistics? Or is there another way to perform a relative fast zonal statistics (for about 500.000 features) in FME?

Kind regrards,

Pieter

You can load attributes and geometries into RCaller (your shape files) data frame. Some of the Tutorials we have on RCaller and on the FME Hub illustrate this. Then in your RCaller script, you should be able to read your DEM just as you are in the example above.


I'm not sure about the equivalent zonal statistics tools in Python. Perhaps someone else can pipe in on that front.


Badge +2

Hi @zpieter, just wanted to let you know we are currently working on adding support for raster input and output to the RCaller, it should be available in a 2019.0 beta build soon. We can update you when the new feature is ready to be tested.


Also, in the mean time, another way to do zonal statistics in FME is to clip the raster to the statistics boundary you want to use, and then use a RasterStatisticsCalculator to process the clipped raster features. I recommend trying this method in 2018.1 (as this is the version I tested, and there seem to have been some issues with the RasterStatisticsCalculator in earlier versions)


Badge +5

Hi @zpieter, just wanted to let you know we are currently working on adding support for raster input and output to the RCaller, it should be available in a 2019.0 beta build soon. We can update you when the new feature is ready to be tested.


Also, in the mean time, another way to do zonal statistics in FME is to clip the raster to the statistics boundary you want to use, and then use a RasterStatisticsCalculator to process the clipped raster features. I recommend trying this method in 2018.1 (as this is the version I tested, and there seem to have been some issues with the RasterStatisticsCalculator in earlier versions)


@xiaomengatsafe Is there already an option to load rasters and shapefiles in rcaller?

I am using the exact same script but then I get

"Error in ogrListLayers(dsn = dsn) : Cannot open data source"

I am trying to call the shapefile using

shape <- readOGR("TEST")

where TEST is the name of the shapefile as it appears in the Rcaller. Removing the quotes does not matter, won't work.

Normally you would add a path here in R, but that would negate the use of Rcaller entirely.

How exactly are you supposed to load shapefiles and rasters in Rcaller?

Badge +2

@xiaomengatsafe Is there already an option to load rasters and shapefiles in rcaller?

I am using the exact same script but then I get

"Error in ogrListLayers(dsn = dsn) : Cannot open data source"

I am trying to call the shapefile using

shape <- readOGR("TEST")

where TEST is the name of the shapefile as it appears in the Rcaller. Removing the quotes does not matter, won't work.

Normally you would add a path here in R, but that would negate the use of Rcaller entirely.

How exactly are you supposed to load shapefiles and rasters in Rcaller?

@wolters You don't need to use the readOGR in the R script. In FME use the Shape reader. Connect Shape file feature type to the RCaller. This would be similar to the examples in the article RCaller: Ins and outs of using R in FME.

Raster support for RCaller was added in FME 2019, so you should be able to pass raster data into the RCaller as part of the input feature. So the article RCaller: Interpolate Points to Raster Through Kriging is a little out of date. You should be able to read the source image with an FME reader and pass that image into the RCaller on the input feature.

Reply