Question

Zonal Statistics II: confusion about Rasterstatisticscalculator


Badge +5

I have a large raster with 1 band (NDVI) though it could also be multiple bands (different vegetation indices). I also have several hundreds of polygons. I would like to use zonal statistics to determine min/mean/max/stdev of NDVI values of these polygons. How can I do this in FME? In ArcGIS and QGIS this is a one click affair.

I am aware of the existence of Rasterstatisticscalculator, but it does not have that much documentation. My current workflow is as follows:

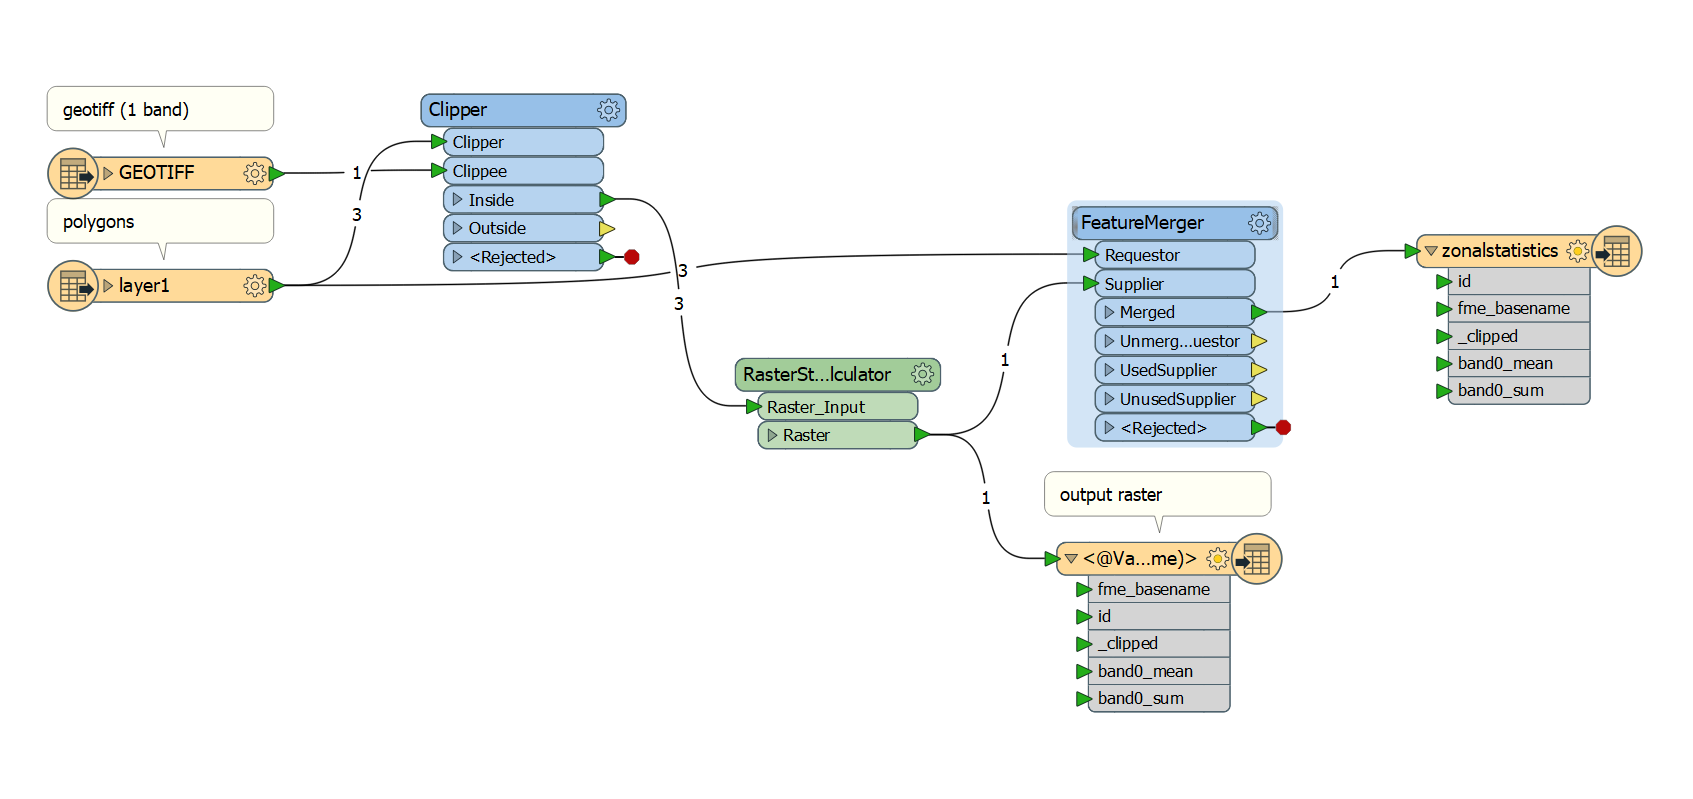
but the following things are confusing me: Why does rasterstatisticscalculator turn the three clipped rasters into 1 raster? And how do I extract the results back into the shapefile? Example workflows of how to perform an efficient zonal statistics would help immensely!

Thanks!


12 replies

Badge +10

In your screendump I do not see the settings you used on your RasterStatisticsCalculator (perhaps you can add a Summary Annotation next time you add a screendump of a workspace), but I guess you should set the GroupBy function to an attribute which you also use in the FeatureMerger to merge the new attributes back to your shapefile.

Hope this helps.

Badge +22

In the Clipper select the Merge Attributes options so that your clipped rasters have a unique ID, then use that ID in the Group By parameter of the RasterStatisticsCalculator.

Badge +5

In your screendump I do not see the settings you used on your RasterStatisticsCalculator (perhaps you can add a Summary Annotation next time you add a screendump of a workspace), but I guess you should set the GroupBy function to an attribute which you also use in the FeatureMerger to merge the new attributes back to your shapefile.

Hope this helps.

Thanks for your comment Lars. I do use the Groupby function for the same attributes as for the featuremerger. Which is why I do not understand why only 1 raster is generated and not 3 in this instance.
Badge +5

In the Clipper select the Merge Attributes options so that your clipped rasters have a unique ID, then use that ID in the Group By parameter of the RasterStatisticsCalculator.

Hi JDH, Thank you for your comment. The input polygons (just 3 to test) have a column called ID with 3 different values (1,2,3). This is merged in the clipper (merge attributes) and also used as group by in the RasterStatisticsCalculator, and as a merger for the Featuremerger
Userlevel 2
Badge +17

It seems to be a defect of the custom transformer. I'd recommend you to contact the author. @DeanAtSafe.

I think you can use series of transformers - the RasterPropertyExtractor (extract cell spacing), the PointCloudCombiner (transform each raster into a point cloud), and the PointCloudStatisticsCaluclator (calculate statistics), in order to perform the same statistics calculation as the RasterStatisticsCalculator.

Badge
@wolters I want to do the same thing, did you finally manage to do it in FME ?


Badge +2

Just wanted to update: there is now a built in RasterStatisticsCalculator (instead of the FME Hub one), and it will output each raster feature individually with calculated statistics. So this workflow should work as expected now.


Also, FME 2019 will add raster support in our Rcaller, so that would be another alternative way to do zonal statistics.
Badge +22

Just wanted to update: there is now a built in RasterStatisticsCalculator (instead of the FME Hub one), and it will output each raster feature individually with calculated statistics. So this workflow should work as expected now.


Also, FME 2019 will add raster support in our Rcaller, so that would be another alternative way to do zonal statistics.
Hi @XiaomengAtSafe,


Are there any plans to update the RasterStatisticsCalculator to have the option to calculate histograms, the way the statisticsCalculator does?


Badge +2
Hi @XiaomengAtSafe,


Are there any plans to update the RasterStatisticsCalculator to have the option to calculate histograms, the way the statisticsCalculator does?


Hi @jdh, we do have a development item tracking histogram calculation for rasters. Discussions in this Idea Page is linked to it.


Userlevel 4
Badge +13
Hi @XiaomengAtSafe,


Are there any plans to update the RasterStatisticsCalculator to have the option to calculate histograms, the way the statisticsCalculator does?


FWIW I'm strongly in favor of doing this. Interested that you'd be happy with the format that stats calc does histograms. We were thinking of not using a list but instead kicking out a set of records (features) each with the value and the count.


Badge +22
FWIW I'm strongly in favor of doing this. Interested that you'd be happy with the format that stats calc does histograms. We were thinking of not using a list but instead kicking out a set of records (features) each with the value and the count.


I'm more in favour of one feature in, one feature out. If I need independent features I can always explode the list.


With the obverse, I would need to reattach the histogram features. I assume the histogram features would be null geometry, cause otherwise cloning the raster would get very heavy, very fast.


Userlevel 4
Badge +13
I'm more in favour of one feature in, one feature out. If I need independent features I can always explode the list.


With the obverse, I would need to reattach the histogram features. I assume the histogram features would be null geometry, cause otherwise cloning the raster would get very heavy, very fast.


We were thinking they'd have NULL geometry, but actually (as an aside) rasters and point clouds in FME use a shared model -- so if you clone a feature that is either a raster or a point cloud, it doesn't actually make a copy at that moment. Both features just point to the same thing. For rasters, if you reproject later, etc. we just "wrap the onion" until you actually do something with the raster -- so no copy is ever made (except for if you hit a raster checkpointer xformer).


But very good to know that you're happy with a list...

Reply