I have a question similar to this.
However, following and reading the links, it is not addressing my task, so far I can tell.
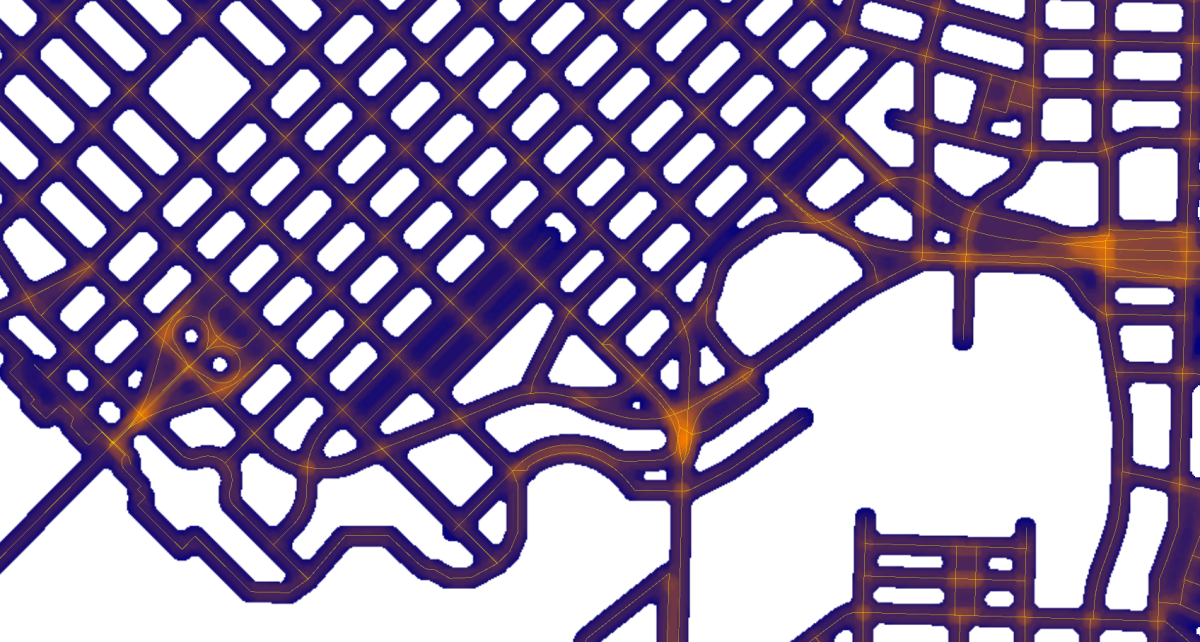
I have a million lines, which I need to analyze to a line density raster, usually done in ArcMap Spatial Analyst Line Density function. The function needs to: 1) take in input lines, 2) adjust cell size, 3) search radius, 4) area unit. I can do it ArcMap, no problem, but as the analysis task is a part of a longer data extraction and modifying process in FME Workbench, I try to keep it there.
Best answer by dmitribagh
View original


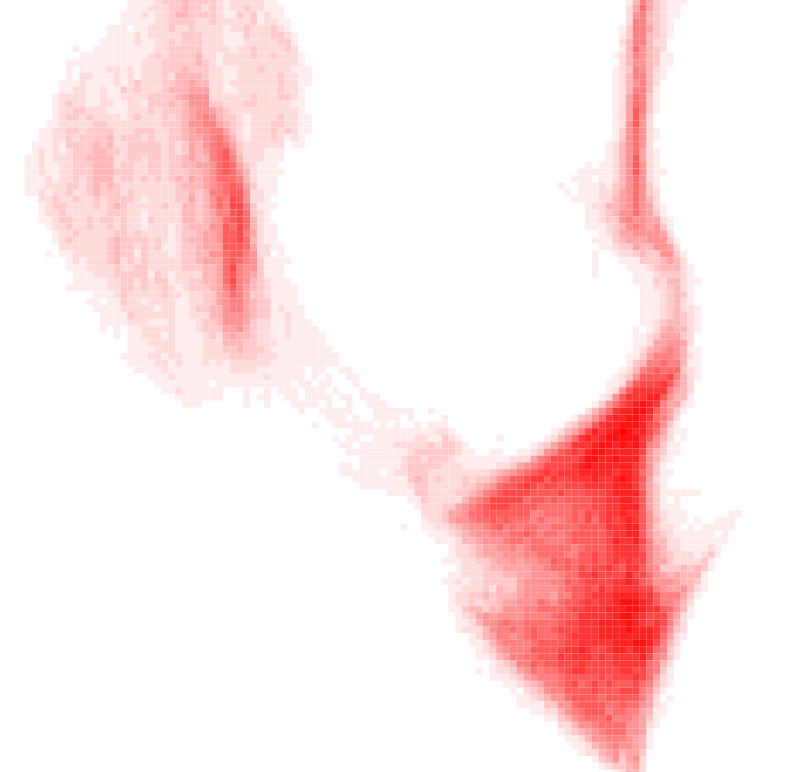
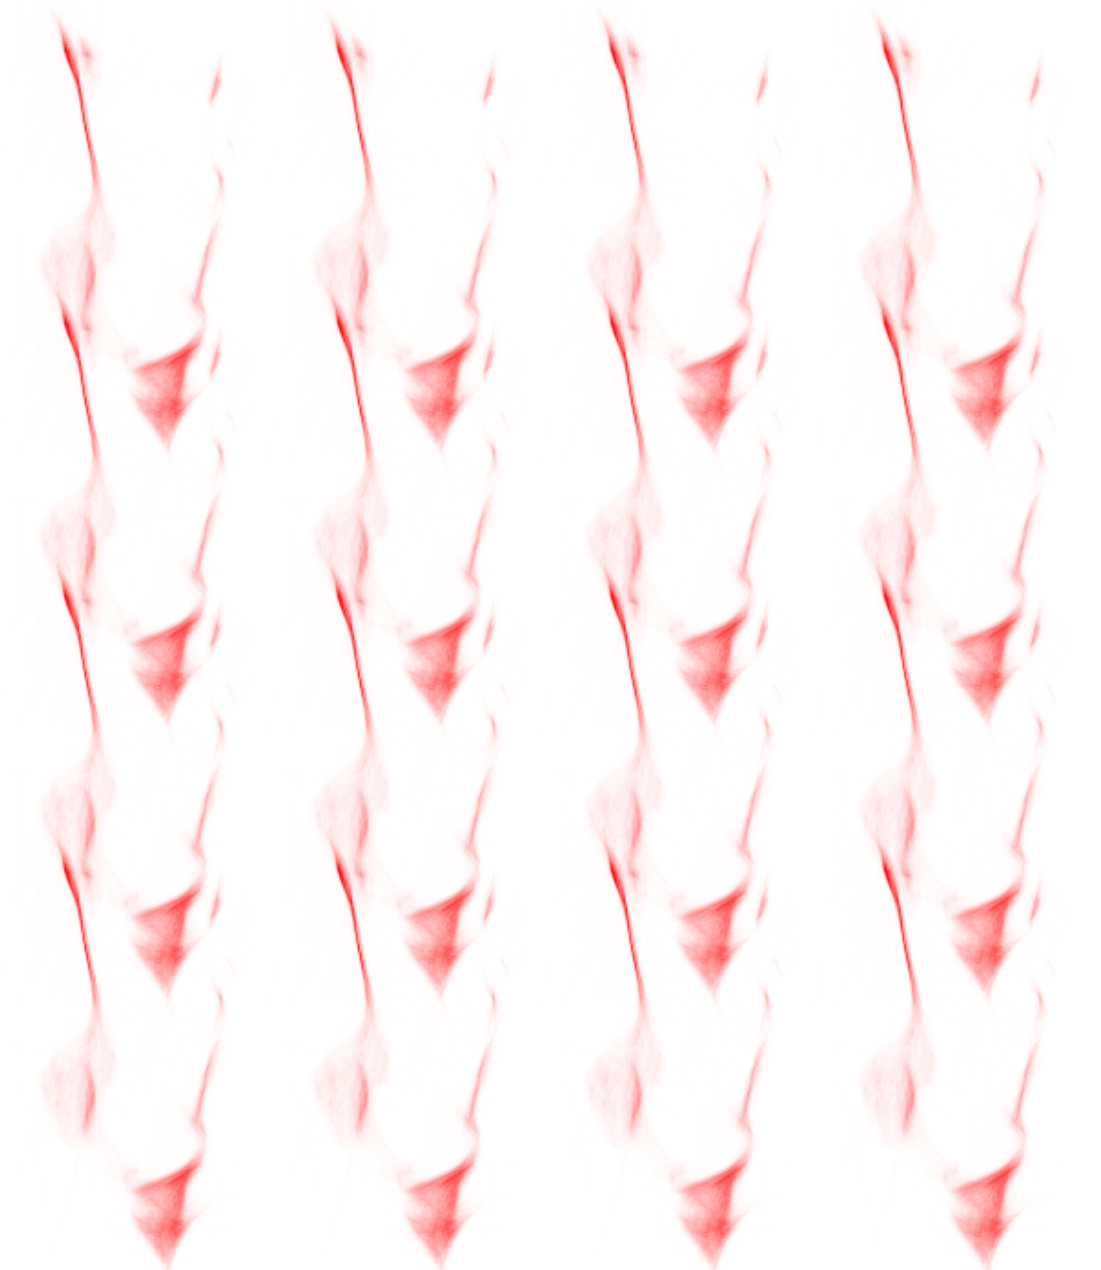
 I am not a big expert in using RasterConvolver - maybe this operation could be done with just one transformer, I used two to remove the bright pixels representing original line pixels.
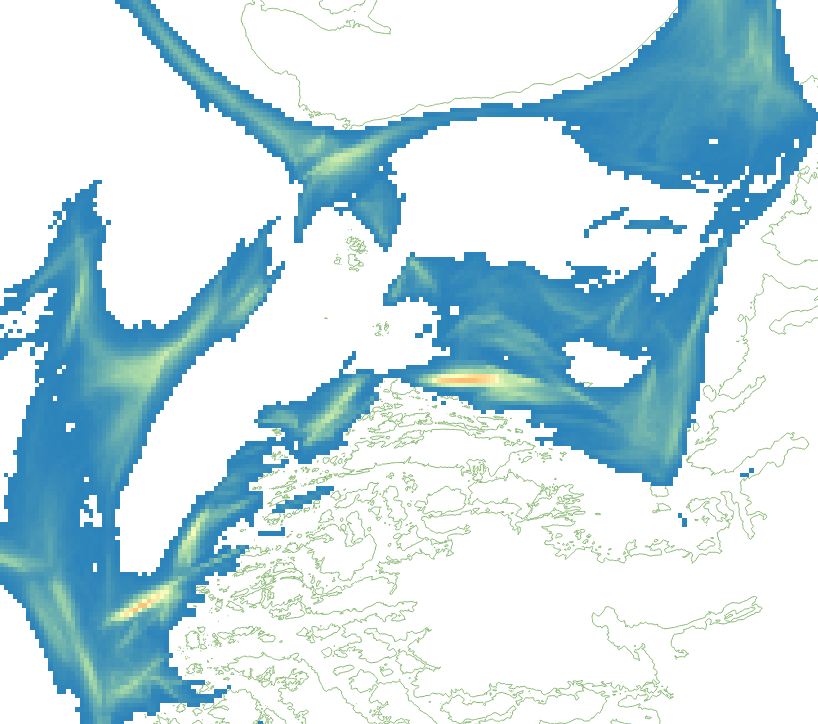
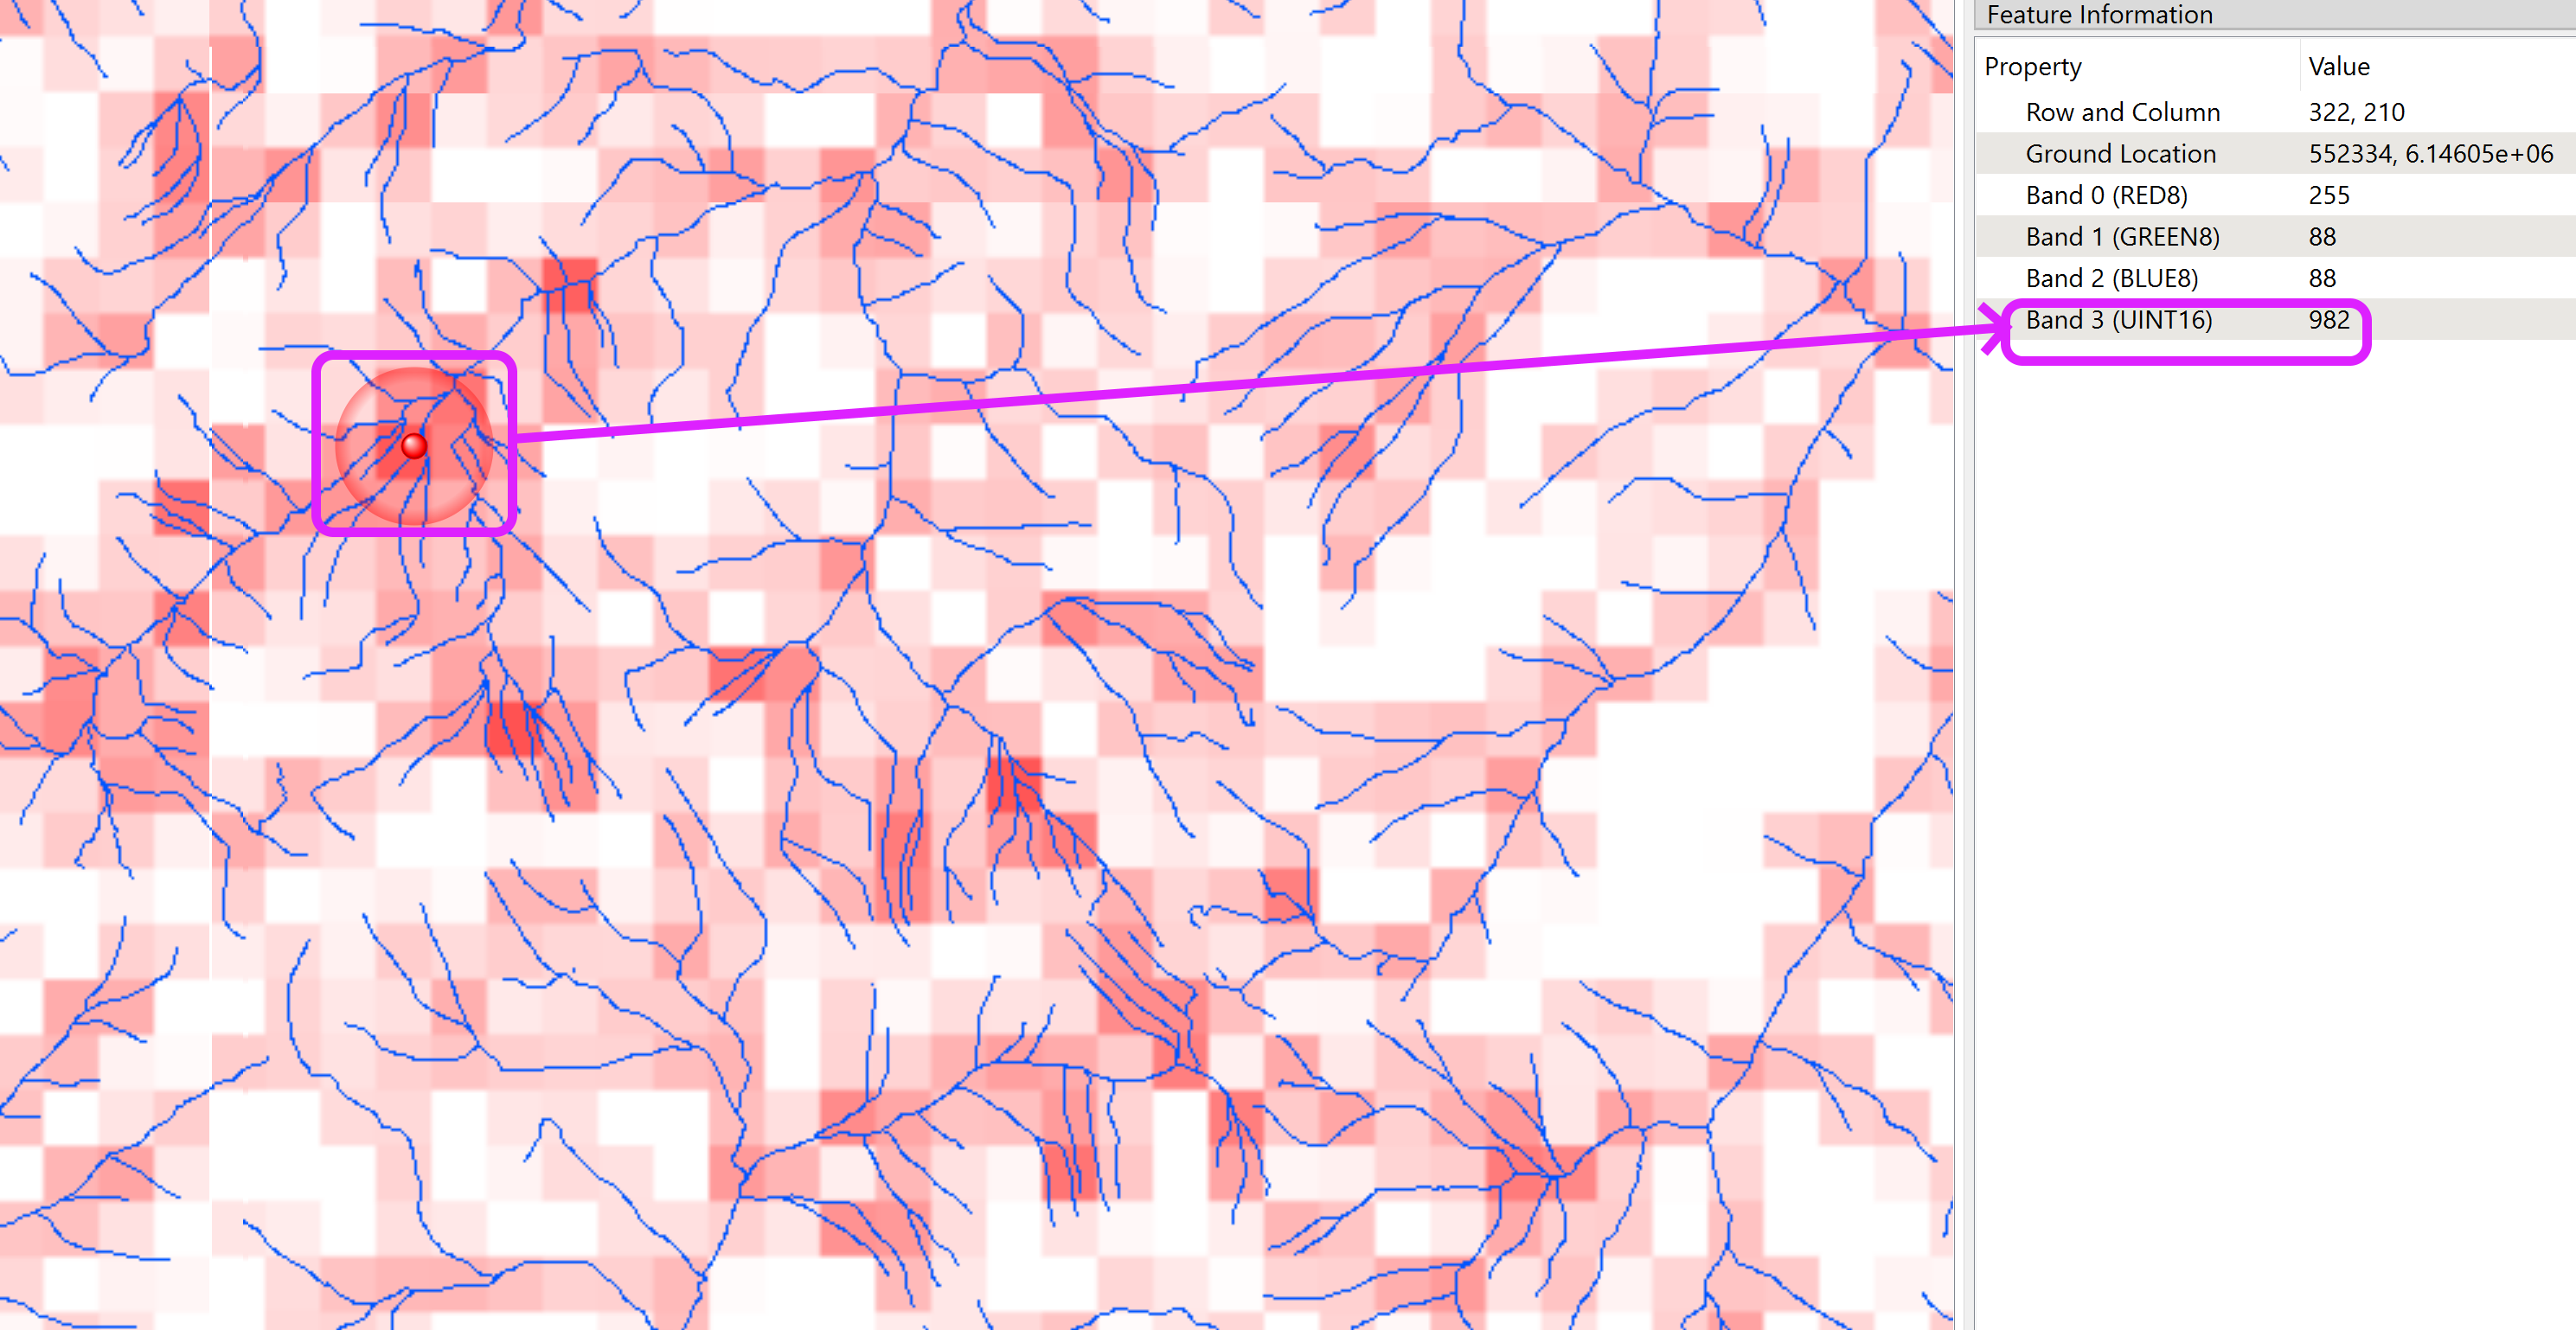 I used a totally different approach - I converted the network (I used rivers this time) to a point cloud, overlaid it with a raster with row and column numbers as pixel values so that each point in the point cloud knows to which raster cell it will eventually belong. Then I calculated how many points I have per cell (grouping by row and column) and rasterized the point cloud.