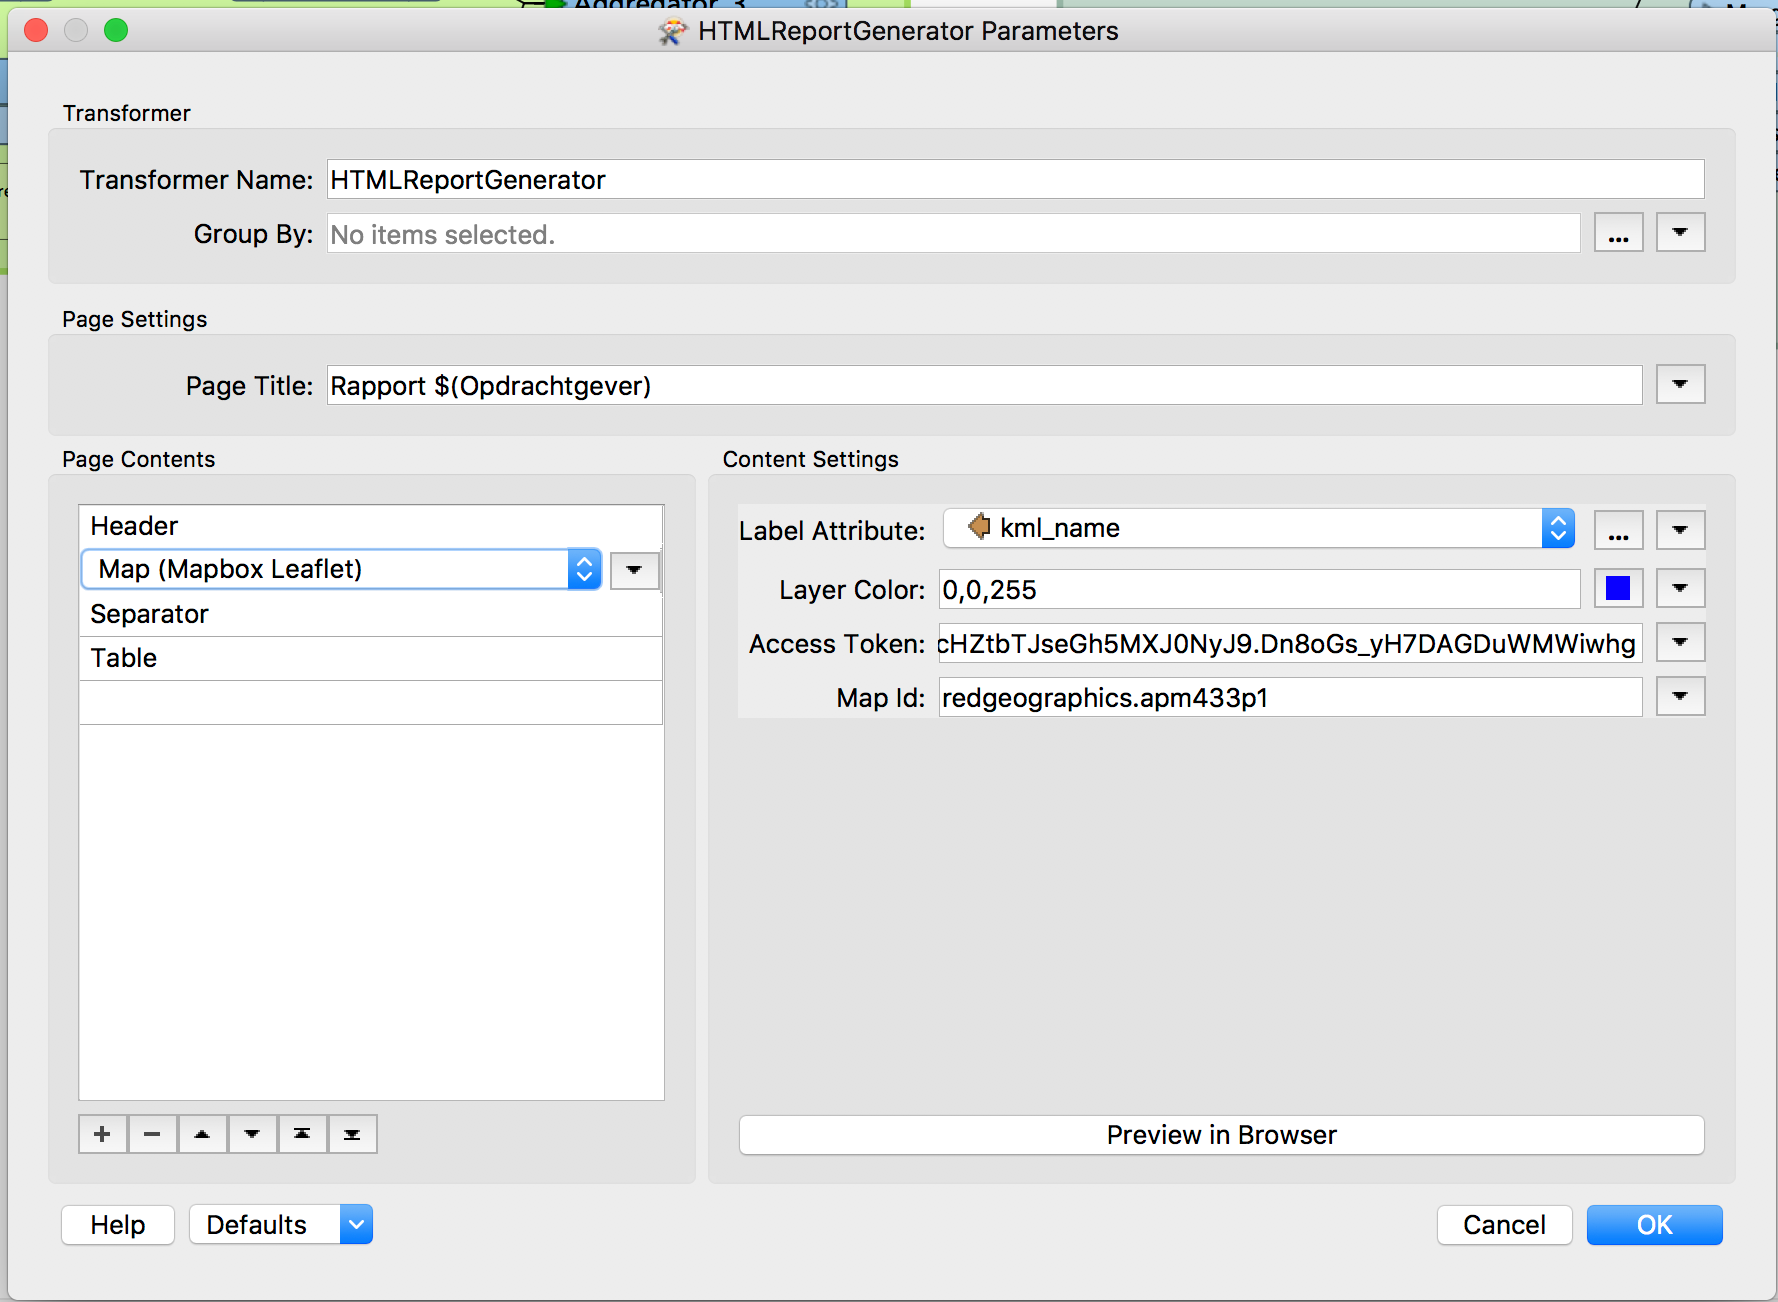
I'm using the HTMLReportGenerator to build a simple HTML page with a map (and charts, tables, etc.). I'm trying to use the Mapbox leaflet option, but encountering some issues. Given I'm new to MapBox, I don't know if I'm just going about this the wrong way.
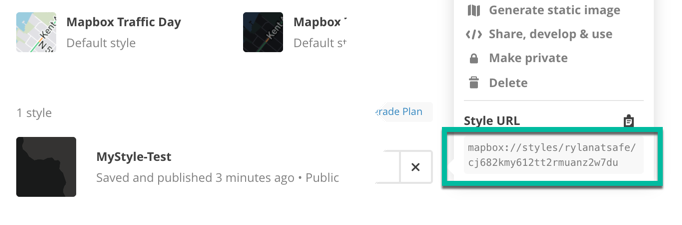
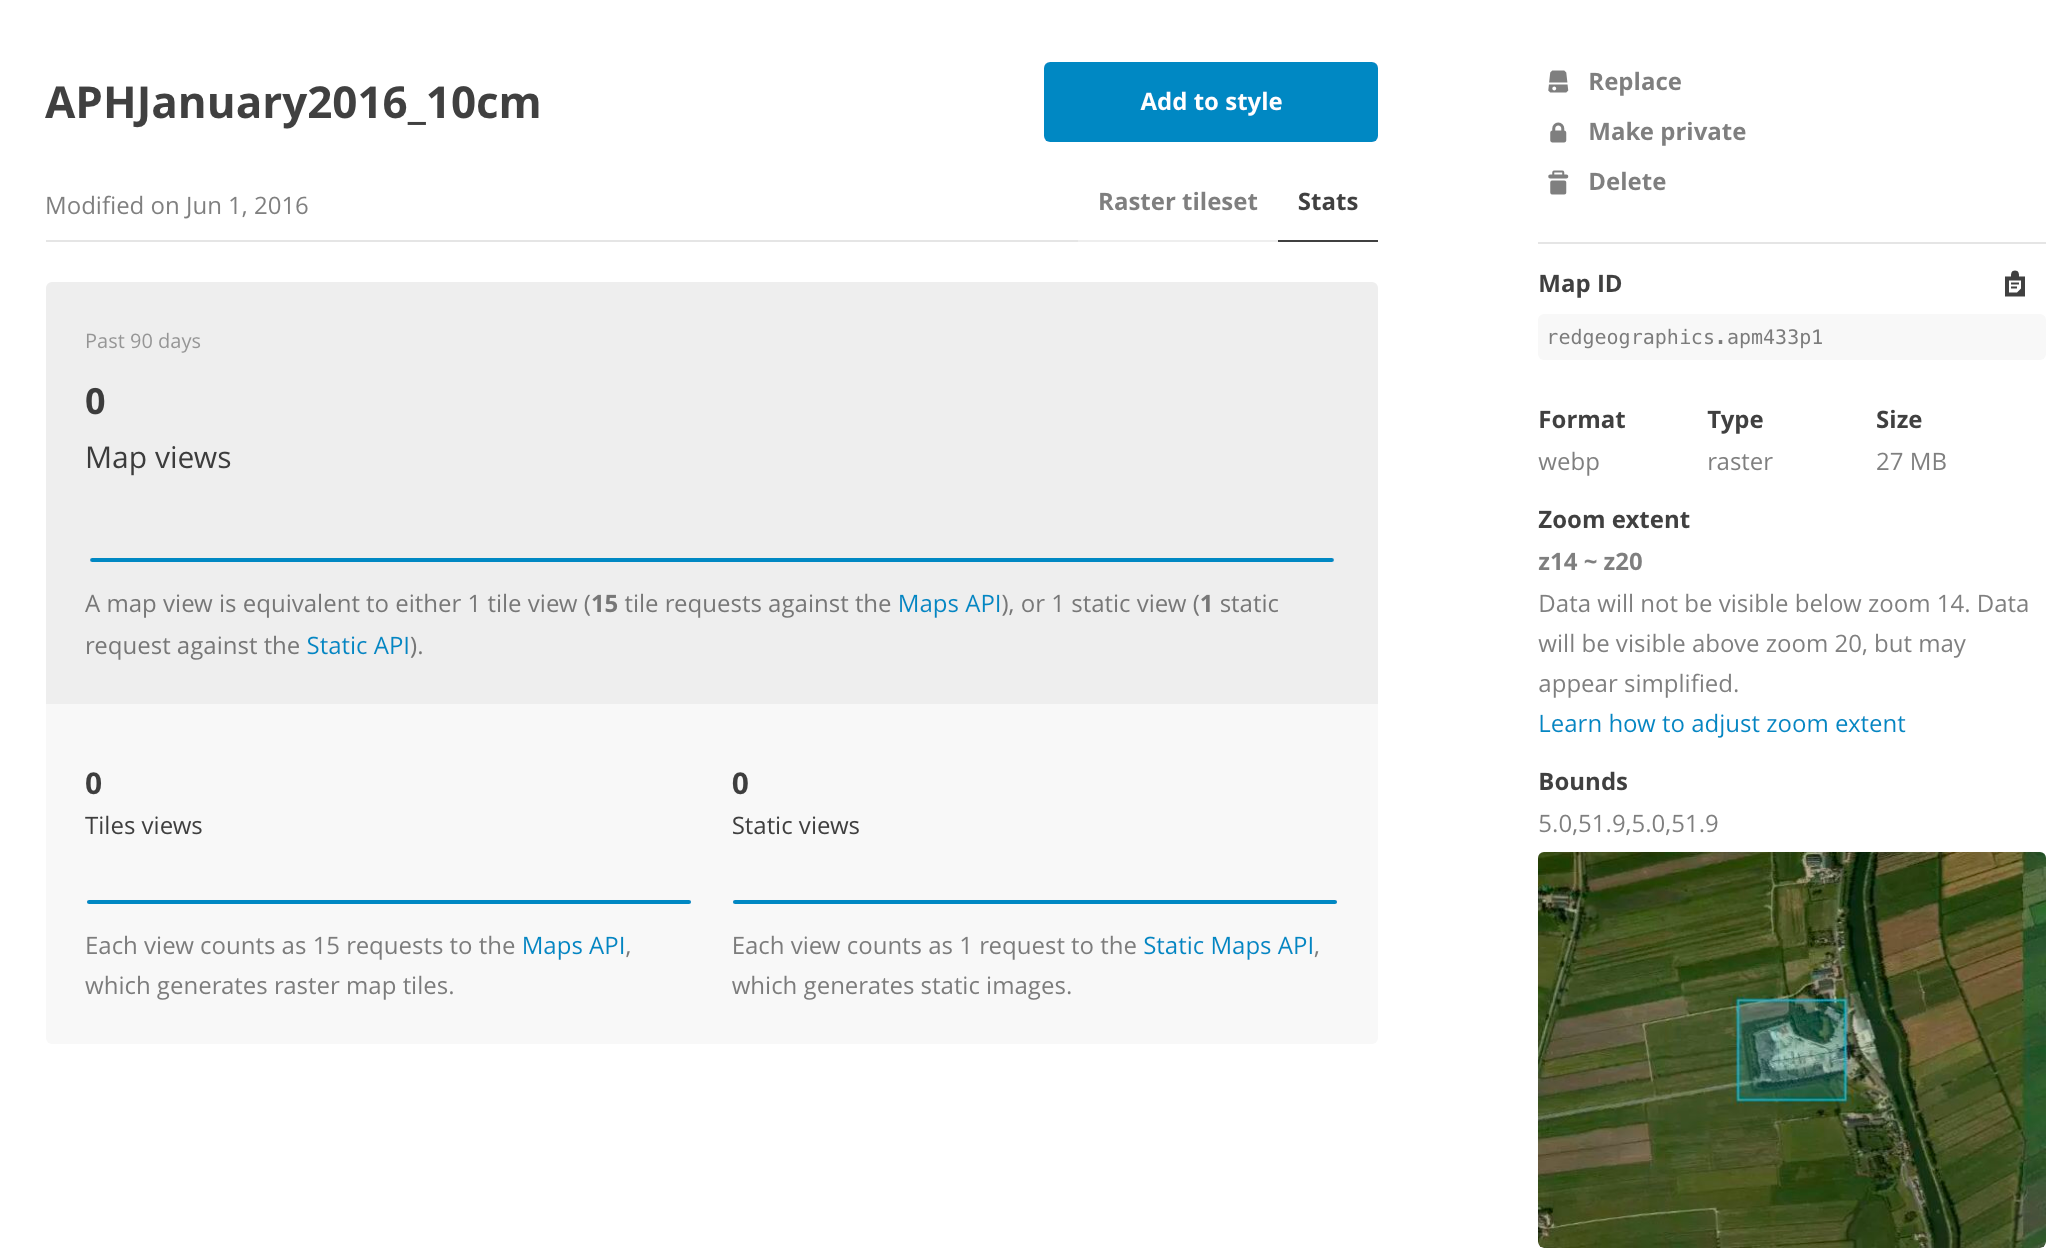
I can specify which MapBox style to use by entering mapid value, but this seems to work only for the default style - if I enter 'mapbox.light' as the map-id value then the MapBox Light map is returned - great. If I enter 'mapbox.mystyle-test' then I was expecting that my custom built style 'MyStyle-Test' from MapBox would be returned, but I get nothing returned. Have I missed something?
My second issue is styling data that I add to the map by passing the features into the HTMLReportGenerator. I've added a MapBoxStyler transformer before the HTMLReportGenerator to style my data (for example set points to a red circle). But when I build the map using the MapBox leaflet option and using the default mapbox style (mapbox.light), the output is still default point styling (blue) on top of the map. Again am I missing something?
Thanks for any help