I want to plot 2 data series in one chart. But the chart generator creates 2 charts or make it as one serie. I have used an list with an feature representing the dataserie. And i tried it without the list.


Userlevel 4
- 8177 replies
-
2 August 2016

Here's an example where I have 5 features entering the ChartGenerator, all having the attributes x, data1, data2:
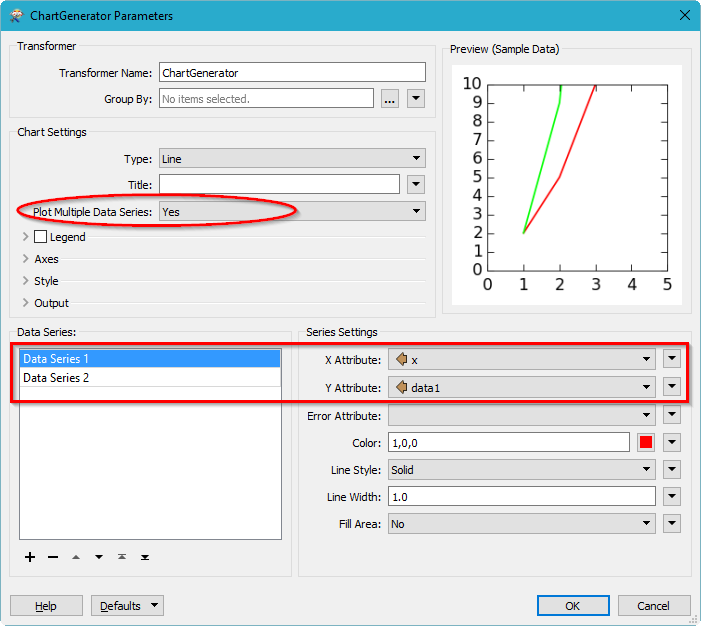
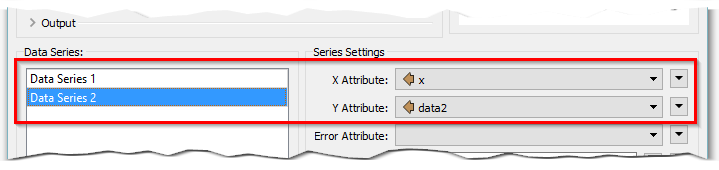
Then select series 2 and set the x,y attributes:
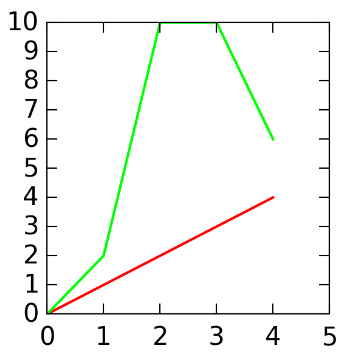
Result
Reply
Enter your username or e-mail address. We'll send you an e-mail with instructions to reset your password.