 Hi!
Hi!
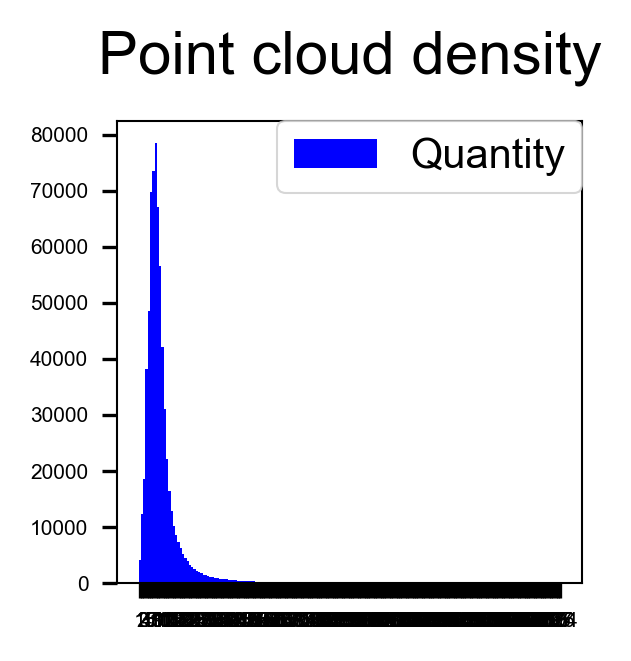
I am a beginner and trying to calculate a histogram showing point cloud density. I succeeded in creating a bar histogram with the ChartGenerator, however, I have problems with the label, especially the x axis. The x axis shows the number of points 1...394. As you can see the x tick interval is probably 1, but of course I would like to change this to a bigger interval
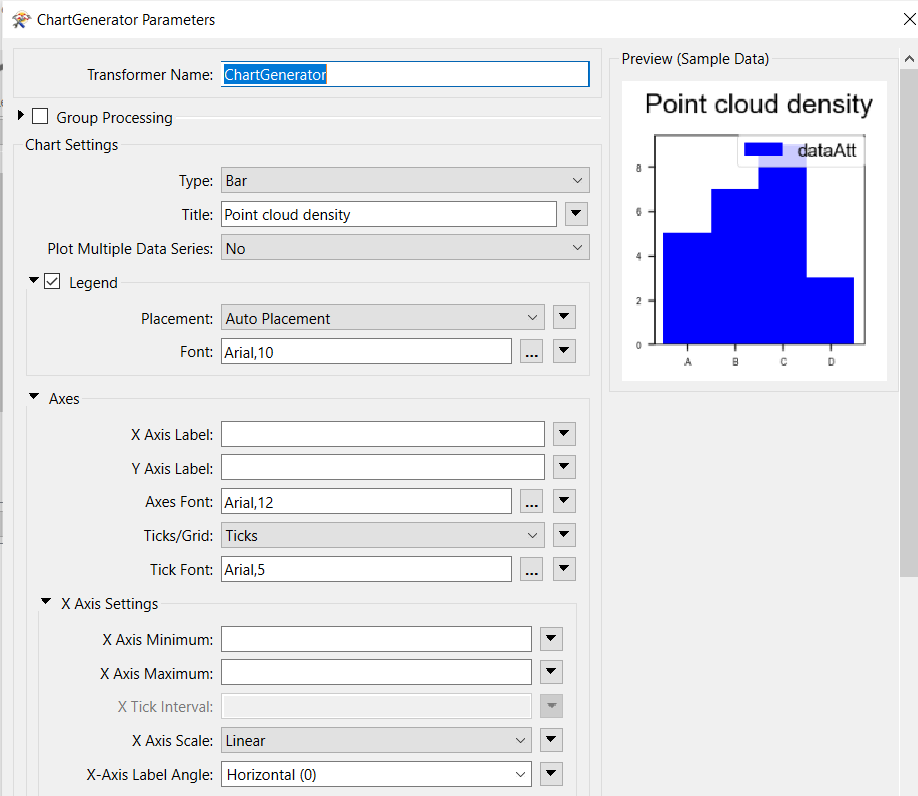
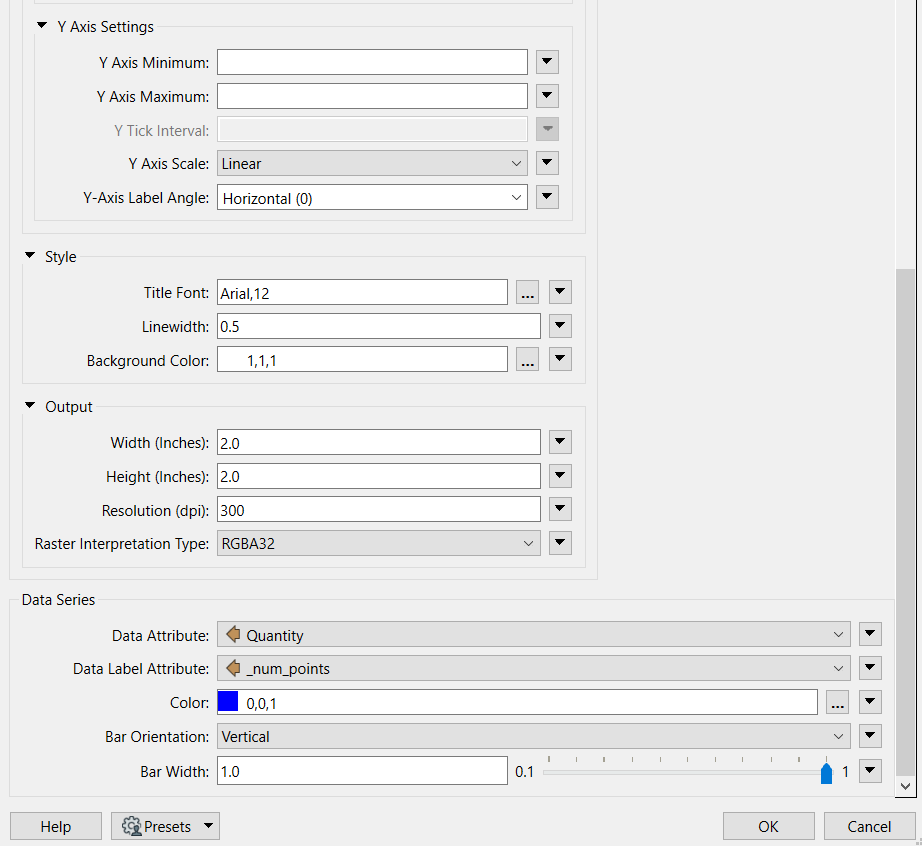
The only problem is that the x and y tick interval is greyed out.
Does anyone know why and how I can activate this?
I upload an image showing the histogram I get as well as the properties of the ChartGenerator.
Thanks in advance!


