Hi, I'm trying to make an html report using the awesome HTMLReportGenerator transformer, I've been able to do some customizations for better results, but when it comes to the charts that the report creates, I'm still not sure how to increase the width it occupies, to get a graphic distributed over the entire page space. I've been reading the documentation for chart.js a bit, which is the js library that this transformer uses to generate the charts, but still haven't found the answer, does anyone know how I can get a larger chart? I have attached an image of the current report that I can generate and as you should see it would look much better if the chart took up all the space, I already moved the legend to the bottom so I have room on that side. Thanks! 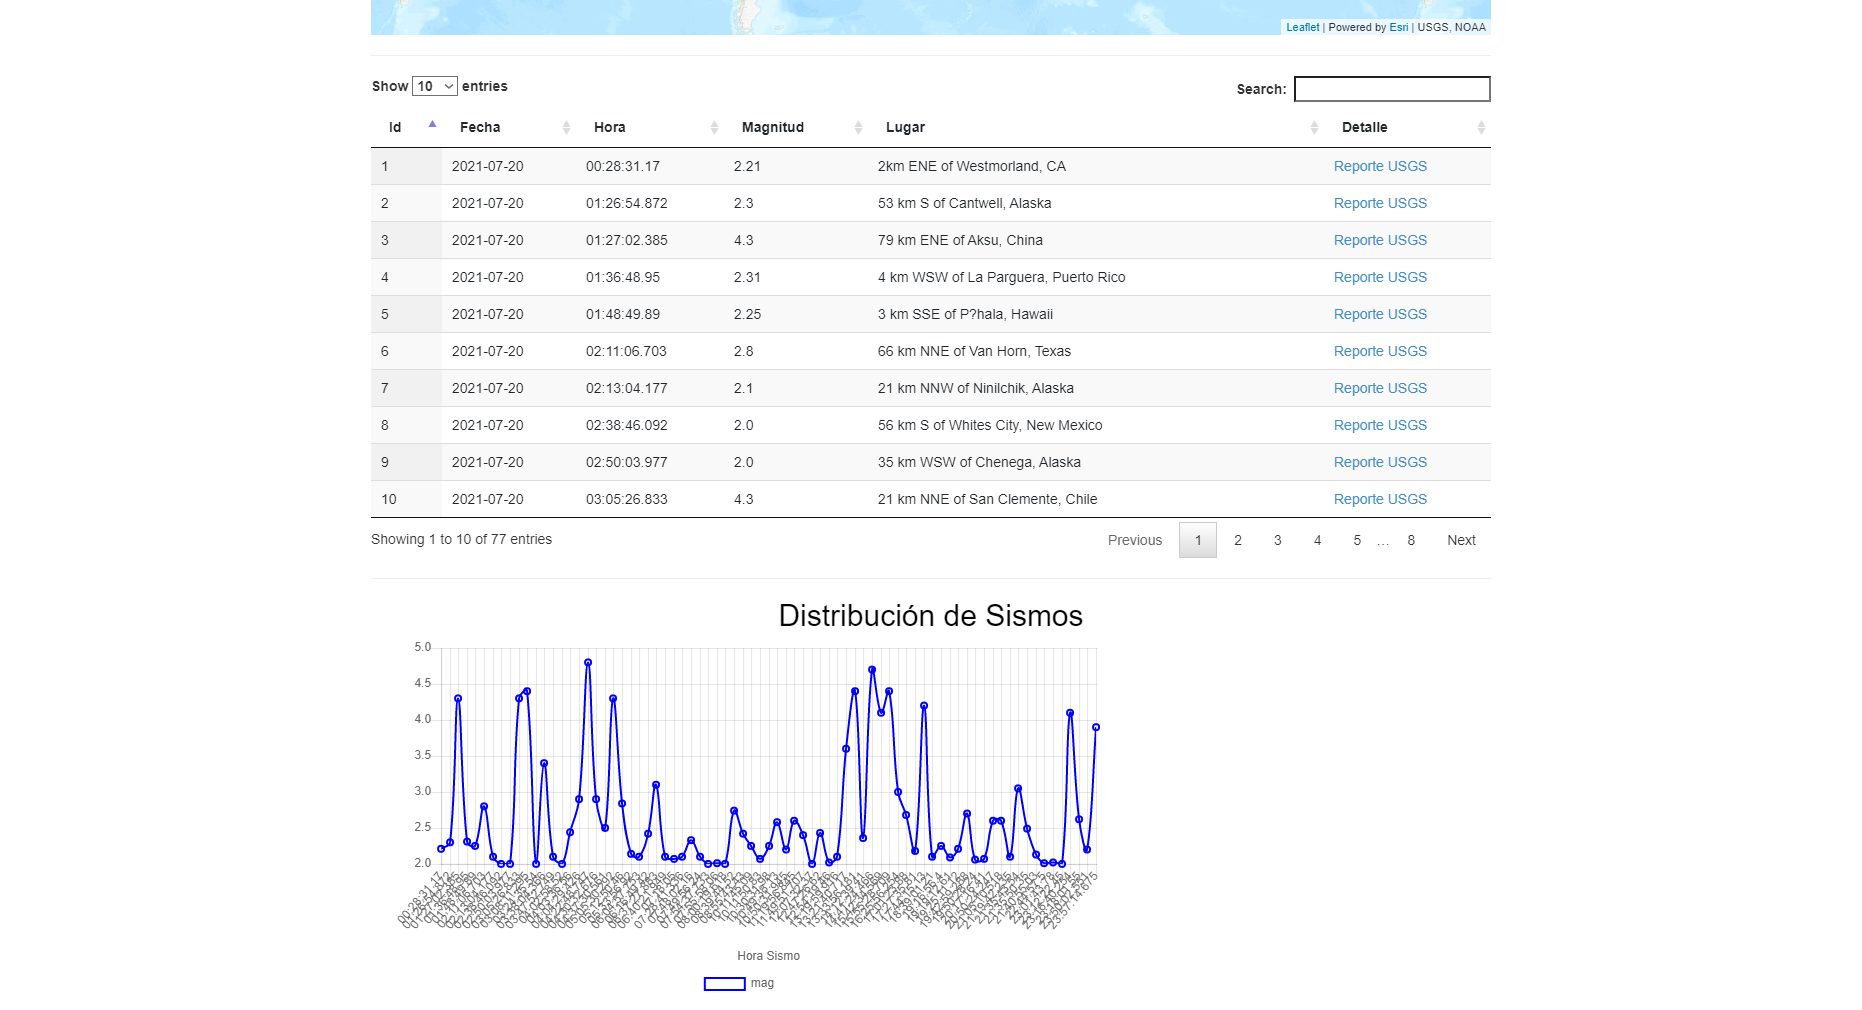

Solved
How can I make wider charts in an HTMLReport
 +2
+2Best answer by redgeographics
Chart.js uses the HTML5 canvas, so what you can do is take the HTML output from the HTMLReportGenerator and look for the <canvas> tag for the chart you want to adjust. It should have height and width properties so you can use a StringReplacer to alter those.
More work, but also a lot more control over the output, would be to use the custom HTML option within the HTMLReportGenerator rather than the Chart one and code the whole chart.js block yourself. This gives you access to all the chart types and options.
This post is closed to further activity.
It may be an old question, an answered question, an implemented idea, or a notification-only post.
Please check post dates before relying on any information in a question or answer.
For follow-up or related questions, please post a new question or idea.
If there is a genuine update to be made, please contact us and request that the post is reopened.


Login to the community
No account yet? Create an account
An FME Account is required to contribute
LoginEnter your E-mail address. We'll send you an e-mail with instructions to reset your password.