Hi all,
I have a shapefile with roads and another shapefile with points that contain a field with the mileage of that roads, and I use the latter to calibrate the routes I create with the former in ArcMap.
Both shapefiles are related with IDs, so there is no risk of asigning a mileage point to the wrong road if it's not snapped to it.
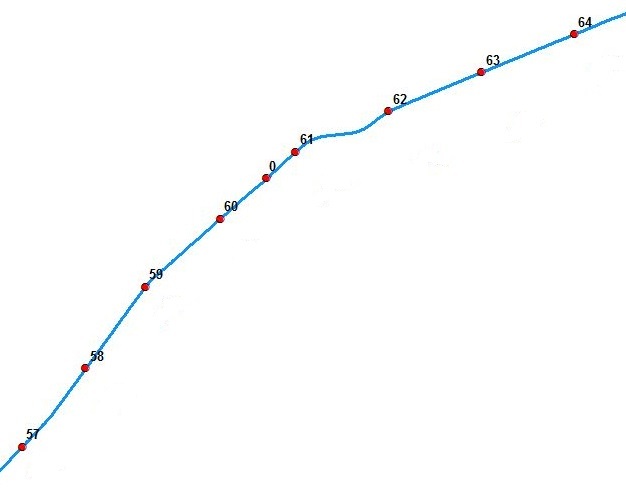
My problem is that the mileage data of some points is out of place, for example you can find:
...42 - 43 - 44 - 0 - 45 - 46 - 47...
And that zero causes the calibrating tool to fail. I've tried to spot it so I can generate a new shapefile without the incorrect mileage points but it always returns me another points and I can't find a way to get it right.
Here is an example:
Gaps in the enumeration are not a problem, but some times there are not only one but a group of points out of place. For example :
...42 - 43 - 44 - 178 - 177 - 176 - 175 - 51 - 52 - 53...
In this case there would be no problem with the gap between 44 and 51. The numbers in between are the ones I would have to spot.
Notice that the growing/descending order of the wrong group of numers is random, so it doesn't have to be the same as in the main correct enumeration.
Here is another example. As you can see, roads are divided into sections and sometimes they do not connect with eachother:
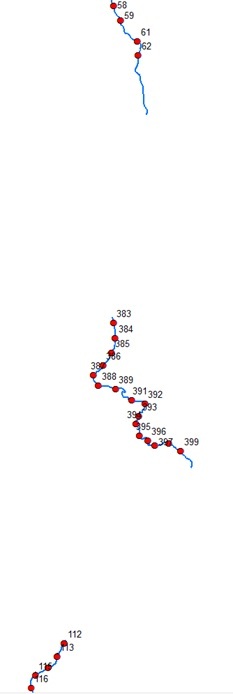
And these would be the tables:
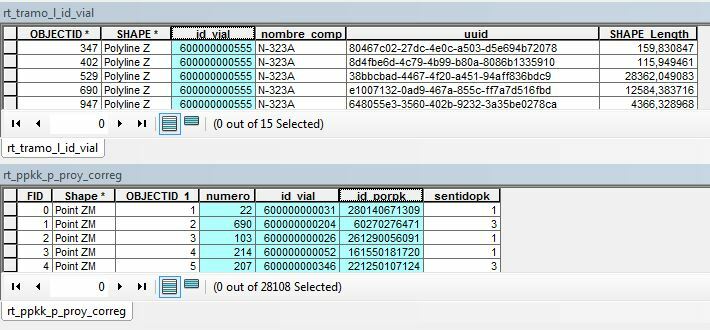
The first one is the roads:
- "id_vial" is the identifier of each road, and shared by all sections of a road
- "uuid" is the identifier for each road section
The second one is the mileage points:
- "id_porpk" is the identifier of each point
- "id_vial" is the field that relates each point to its correspondant road
- "numero" is the mileage value for each point
Also I attach a sample to test. Two shapefiles, one with a couple of roads with these two cases and the other with its correspondant mileage points.
Thank you all in advance for your answers!


