
I have some data that I have run through the statistics transformer in the format shown below i.e. ID, Year, Count
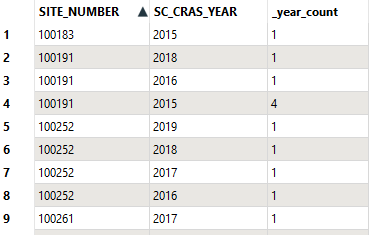 I want to create a chart but need to include the years that have a zero value in a five year period i.e. 2015 to 2019.
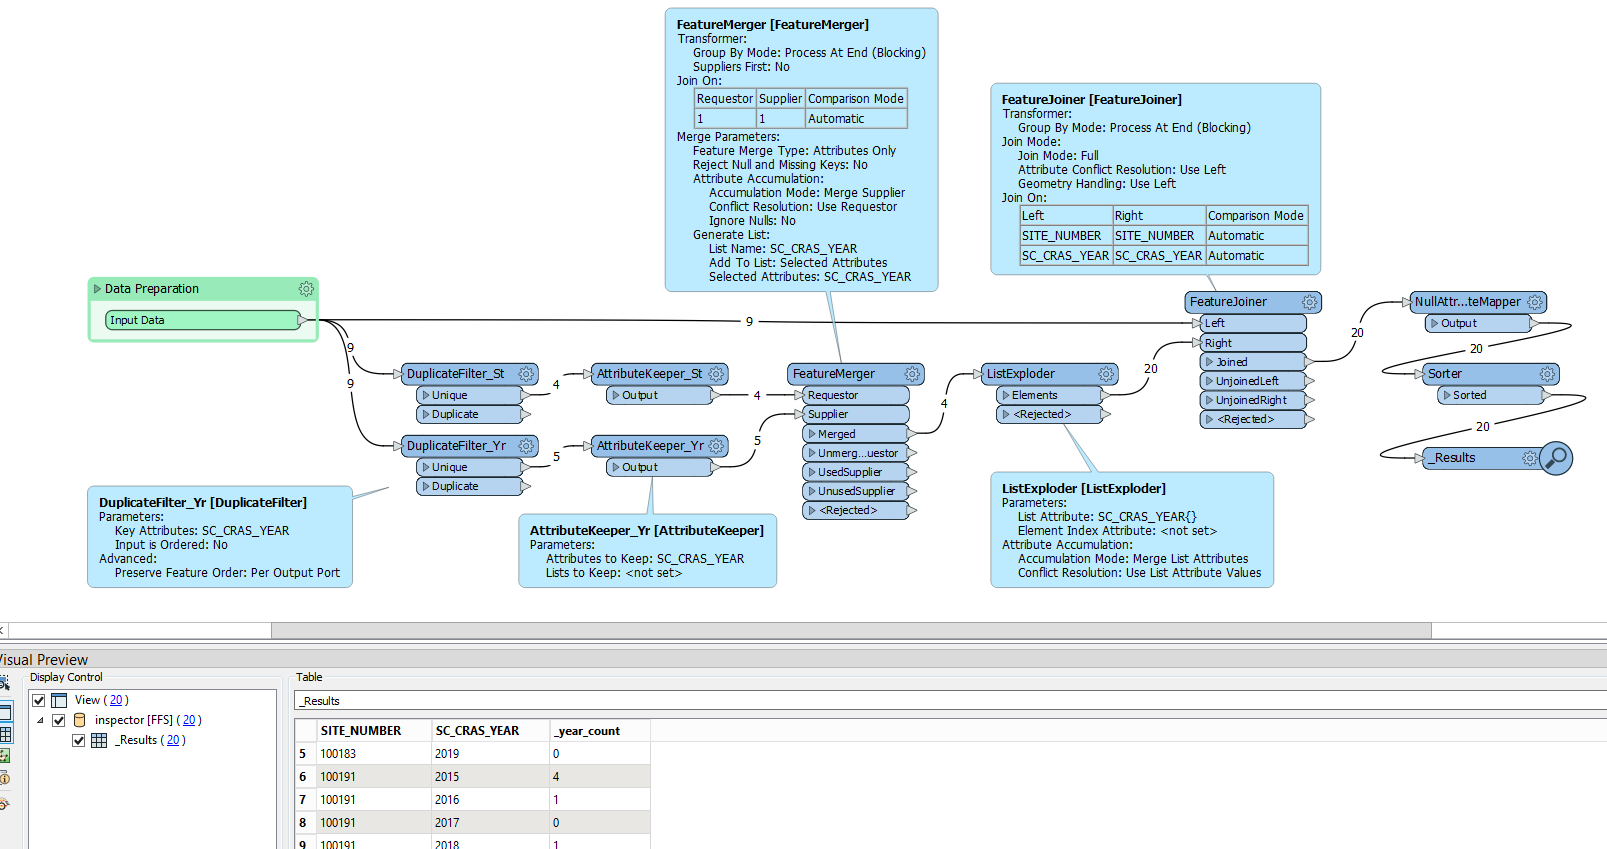
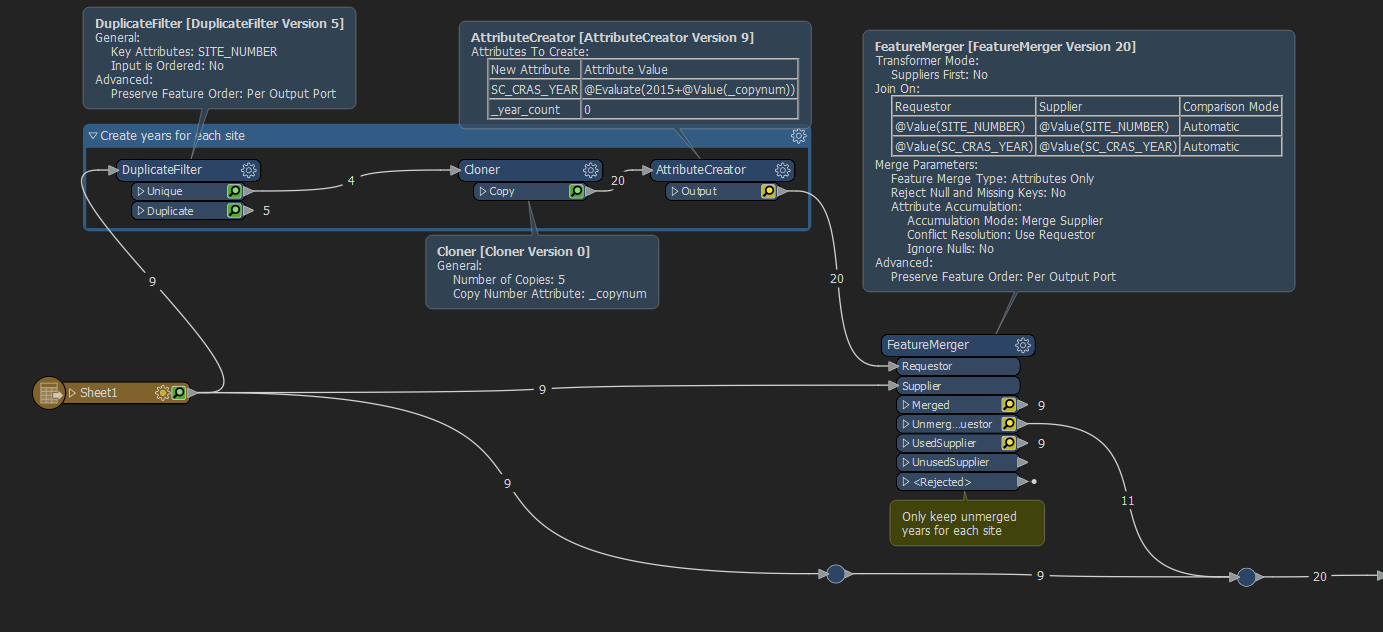
How do I manipulate the data to add in the missing years with a zero value?
Any assistance would be greatly appreciated.