
Update:
I was able to use this link to get my reporting workbench started:
https://community.safe.com/s/article/Monitoring-FME-Server-Job-Activity-using-the-REST-API
Best answer by keziaatsafe
View original


 +2
+2
Update:
I was able to use this link to get my reporting workbench started:
https://community.safe.com/s/article/Monitoring-FME-Server-Job-Activity-using-the-REST-API
Best answer by keziaatsafe
View original
 +6
+6
Hi @kbraun77 ,
That is a great article to start with! With the FME Server REST API, you can get statistics on specific workspaces or Server apps. This article, Tips for Working With the FME Server REST API in FME Workbench showcases a Weekly Job Metrics Dashboard, but you can work the logic for a 30 day time line and write out to a different format if you're not looking for an HTML dashboard output.
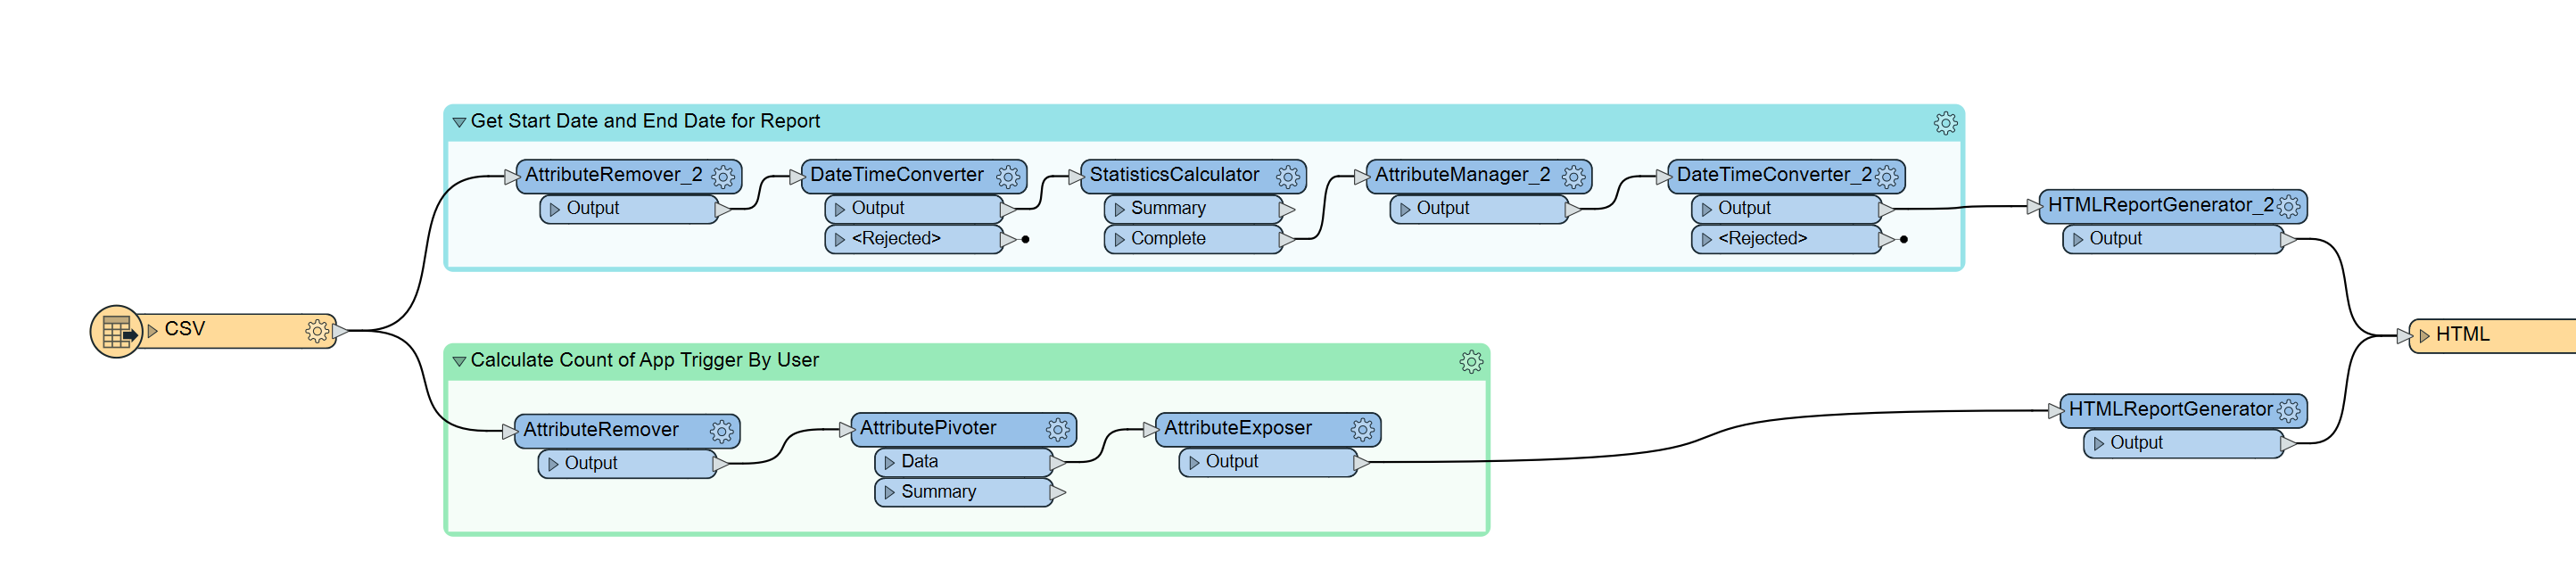
You could build a workbench similar to the other workspaces in the Dashboards repository that start by reading in the CSV file that the JobHistoryStatisticsGathering.fmw workspace outputs ($(FME_SHAREDRESOURCE_DASHBOARD)\\temp\\JobHistorySnapshot_*.csv). You can have two bookmarks, one to get Start Date and End Data for Report, and a second bookmark with transformers to calculate count of a specific Workspace. Finally, you can write out to an HTML file if or any other format. In this example, I'm reading in a simpler CSV file and calculating the amount of times an app was triggered by a user.
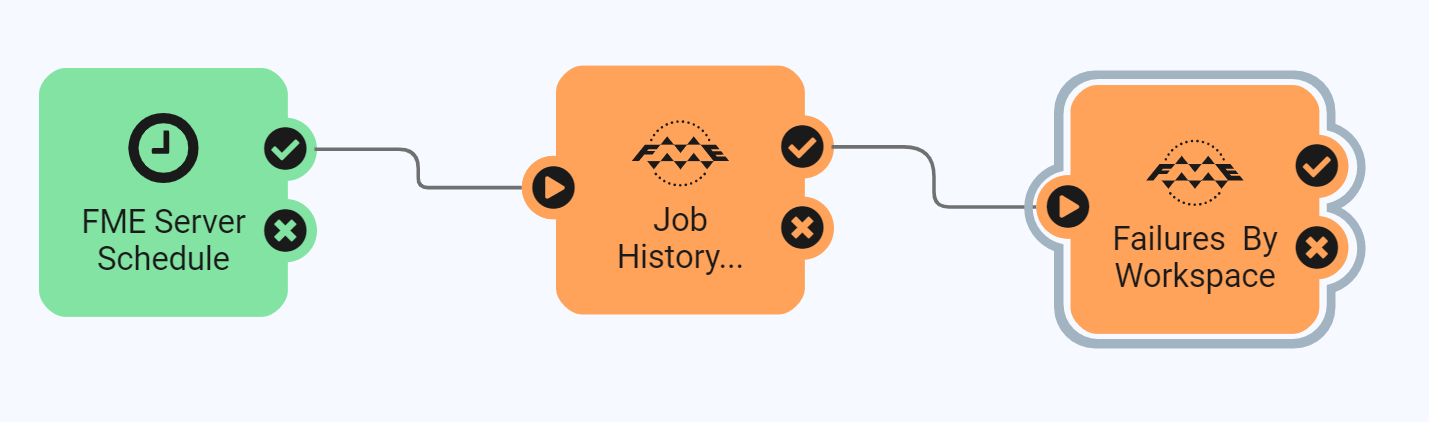
 Then, you can create an Automation with a schedule trigger to run the JobHistoryStatisticsGathering.fmw workspace. From the success port of the JobHistoryStatisticsGathering.fmw workspace, you can attach another Run a Workspace action to run the workspace you created for the amount of times a workspace was ran (Failures By Workspace.fmw as an example).
Hope this helps!
+2
Hi @kbraun77 ,
That is a great article to start with! With the FME Server REST API, you can get statistics on specific workspaces or Server apps. This article, Tips for Working With the FME Server REST API in FME Workbench showcases a Weekly Job Metrics Dashboard, but you can work the logic for a 30 day time line and write out to a different format if you're not looking for an HTML dashboard output.
You could build a workbench similar to the other workspaces in the Dashboards repository that start by reading in the CSV file that the JobHistoryStatisticsGathering.fmw workspace outputs ($(FME_SHAREDRESOURCE_DASHBOARD)\\temp\\JobHistorySnapshot_*.csv). You can have two bookmarks, one to get Start Date and End Data for Report, and a second bookmark with transformers to calculate count of a specific Workspace. Finally, you can write out to an HTML file if or any other format. In this example, I'm reading in a simpler CSV file and calculating the amount of times an app was triggered by a user.
Then, you can create an Automation with a schedule trigger to run the JobHistoryStatisticsGathering.fmw workspace. From the success port of the JobHistoryStatisticsGathering.fmw workspace, you can attach another Run a Workspace action to run the workspace you created for the amount of times a workspace was ran (Failures By Workspace.fmw as an example).
Hope this helps!
Thank you, this is great!
Enter your username or e-mail address. We'll send you an e-mail with instructions to reset your password.