Question

I'm experiencing issues with Optimizing Memory Usage on FME Server job with 22M records. I'd like to know what part of the process causes that much memory consumption.


2021-05-14 11_00_41-job_7246_0.log - glogg2021-05-14 11_02_20-job_7246_0.log - gloggHi Everyone!

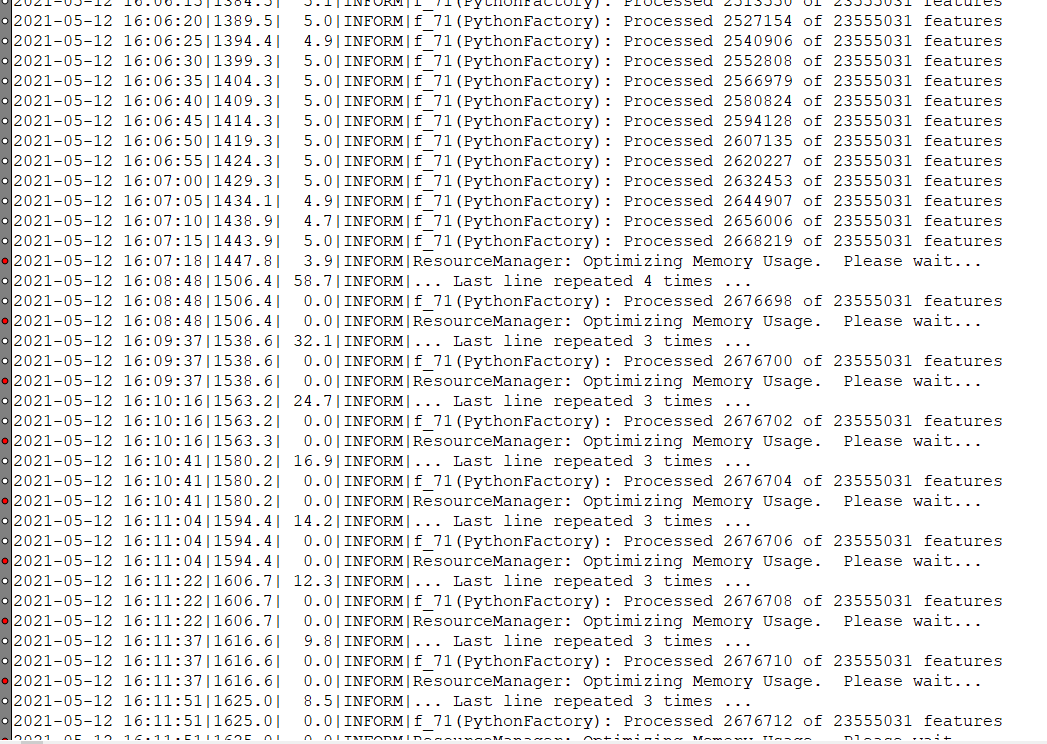
Here's a part of the log that I'm trying to decode. How to check what exactly is f_71 (PythonFactory)? How to link this to some specific Transformer or part of the FME process?

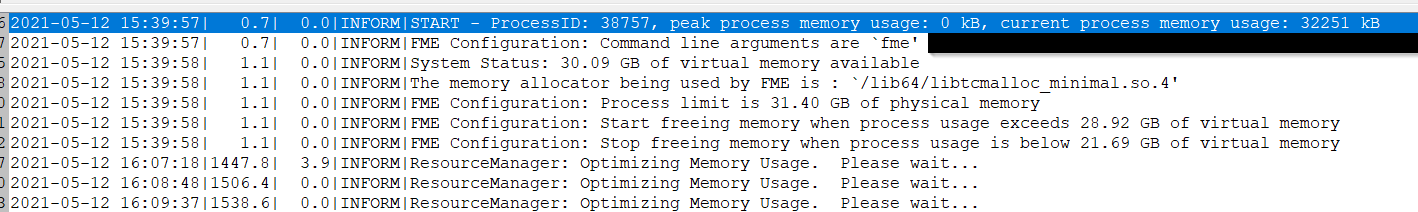
Second question is, why there is no information about peak process memory usage on the FME Server? Locally I can see this value populated in the logfile, while on the FME Server it's always 0kB.


2 replies

Userlevel 1
Badge +11

Hi @gisupanalizy​,

It would likely be best to check the workspace in FME Workbench and see if a transformer was renamed or if there are any custom transformers. For the workspace itself, a good place to start is to see if you can simplify the workspace to narrow down the problem through partial runs to see what's causing that kind of logging. Disabling unrelated objects will also help here. There's a bit more on this in steps 6a and 6b of this Debugging Guide for Workspaces.


Another resource that may be helpful is this article on Performance Tuning FME, as well as How to Control Server Engine Memory Usage. I'm not too sure why it's reporting 0KB at the start, it's possible that there's something we could be doing better there, but I'll leave that to any other server experts Safer or otherwise to chime in as this isn't my area of expertise! Hope that helps a bit for getting started!

Userlevel 5
Badge +25

What version of FME Server are you using? I recall "a while back" there was a version on FME Cloud (and possibly FME Server too) which indeed reported memory usage always being 0kb

Reply