Question

Counting how many values is within range

  • 15 February 2018
  • 7 replies
  • 11 views

Hi,

I'm starting to getting know FME, and I have such problem:

I need to sum occurrence of values from one table within ranges from another one. Ranges needs to be taken from another table because they're changing sometimes and there is a lot of them. I've created min and max column but I don't know how to deal with searching and counting. I want to know how many records is in every range.

EDIT:

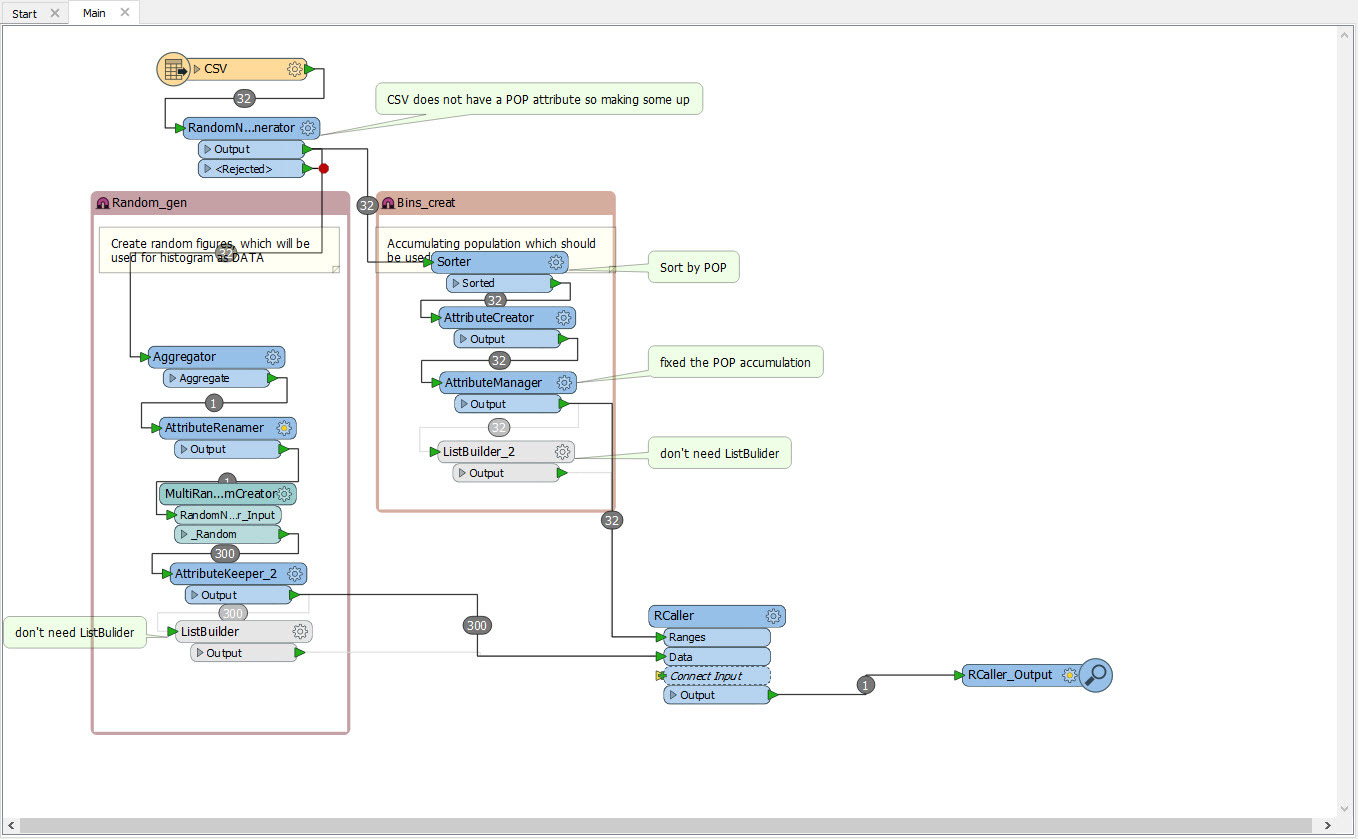
I've added example of my data and fmw.


7 replies

Badge +2

This would be tricky to accomplish using FME transformers like StatisticsCalculator or ListHistogramer because of the dynamic nature of your ranges. So it might be a task for the RCaller and using the R hist() function. As we suggest in the article Ins & Outs of Using R in FME, it's useful to develop your R script in the R Console - see the example at the end of this answer. Then copy that into the RCaller. I've attached a workspace that I hope illustrates a solution to your histogram/count question. 

FME 2017 Example: rhistogramexample.fmw

R script: breaks=c(Ranges$myranges)values=c(Data$mydata)hist_results=hist(values,breaks,plot=FALSE)results=toString(hist_results$counts)fmeOutput<-data.frame(results)

And here is what it would look like debugging in the R console:

> breaks=c(0,5,15,20,30)> values=c(1,2,3,4,5,6,7,8,9,10,12,13,14,15,17,18,20)> hist_results=hist(values,breaks,plot=FALSE)> print (hist_results)$breaks                    *** this is the hist() function results[1]  0  5 15 20 30 $counts[1] 5 9 3 0 $density[1] 0.05882353 0.05294118 0.03529412 0.00000000 $mids[1]  2.5 10.0 17.5 25.0$xname[1] "values" $equidist[1] FALSE attr(,"class")[1] "histogram"# extract the $count part of the hist() function results> results=toString(hist_results$counts) > print (results)[1] "5, 9, 3, 0">  
It looks promising but when I run it there is such error info: invalid number of 'breaks'


I also tried to implement it to my data and have some questions:


- ranges and data should be lists?


- X_creation_instance -> is not mandatory? to be honest I don't know where it comes from and what for if I already have data and ranges.


Userlevel 2
Badge +17
It looks promising but when I run it there is such error info: invalid number of 'breaks'


I also tried to implement it to my data and have some questions:


- ranges and data should be lists?


- X_creation_instance -> is not mandatory? to be honest I don't know where it comes from and what for if I already have data and ranges.


You have to install R into your machine and set its executable file path in FME Options. See the Usage Notes section in the help on RCaller.


Badge +2
It looks promising but when I run it there is such error info: invalid number of 'breaks'


I also tried to implement it to my data and have some questions:


- ranges and data should be lists?


- X_creation_instance -> is not mandatory? to be honest I don't know where it comes from and what for if I already have data and ranges.


@kabinczyk if you can include a small example of your data and the ranges csv we can probably help.


In my example, the data must be a separate FME feature for each data value and also, the ranges (breaks) must be a separate feature for each break value (hence 5 features for the Ranges)


(I haven't figured out how to pass a vector directly into the RCaller as a single feature i.e myranges = 0,5,15,20,30 or 0 5 15 20 30)


You have to install R into your machine and set its executable file path in FME Options. See the Usage Notes section in the help on RCaller.


Thank you, RCaller installed already :)


Badge +2

@kabinczyk Thanks for including the sample data and the workspace. I've made a few changes. The issues you're having are around data preparation rather the the R script (which I haven't had to change).

- the CSV did not include the POP attribute so I added a RandomNumberGenerator to make some up.

- I made minor changes to the range creation to get valid 'bins' in the myranges attribute

- you don't need the ListBuilders. The RCaller doesn't recognize FME lists. Each FME feature becomes a row in the data.frame that FME passes to the RCaller as the source data. So you ass separate features into the RCaller and they are added to data frame.

Here's my workspace:

I've attached the 2017 version of the workspace: histogram-2017.fmwt

Now it works perfect. But of course I don't know how can I convert this string with counts into column that I could add into my initial data. OK, I have the results as string in one cell. Now I want to assign it one by one to the input table. First city=first number from my RCaller string etc. I'm not able to figure it out :/


Reply