Question

Automation Logs - filtered data


Badge +3

Hi,

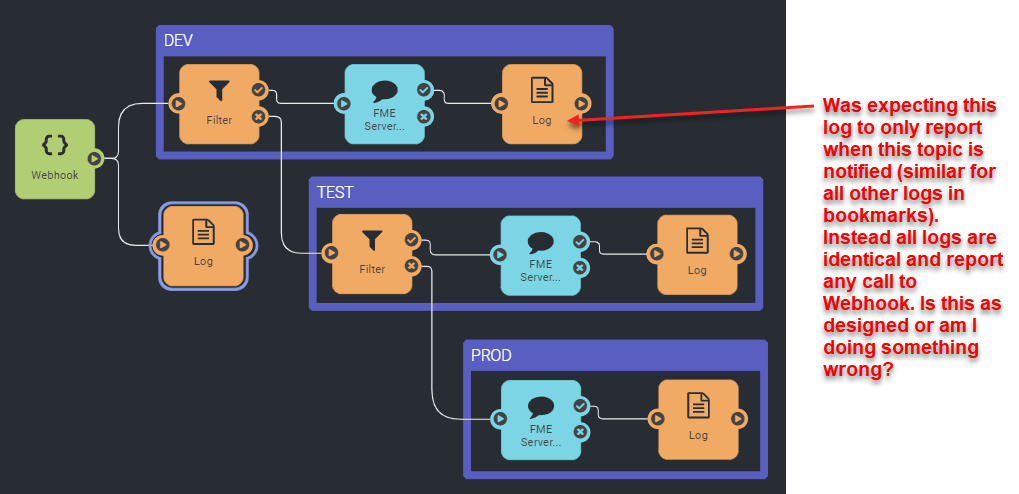
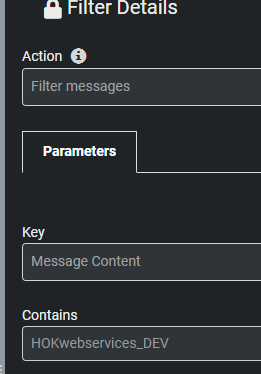
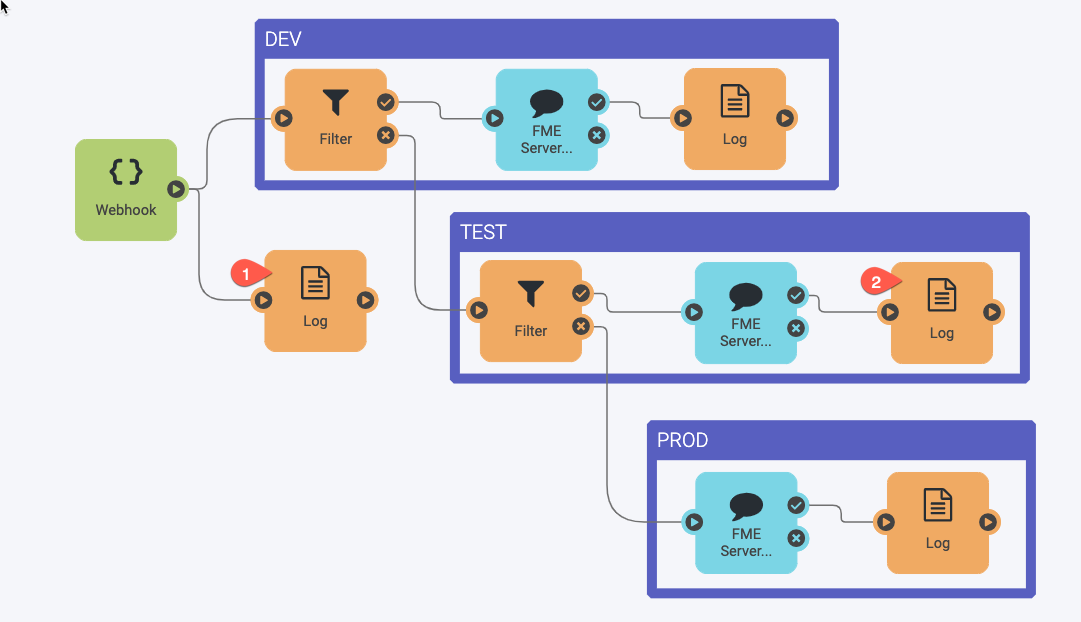
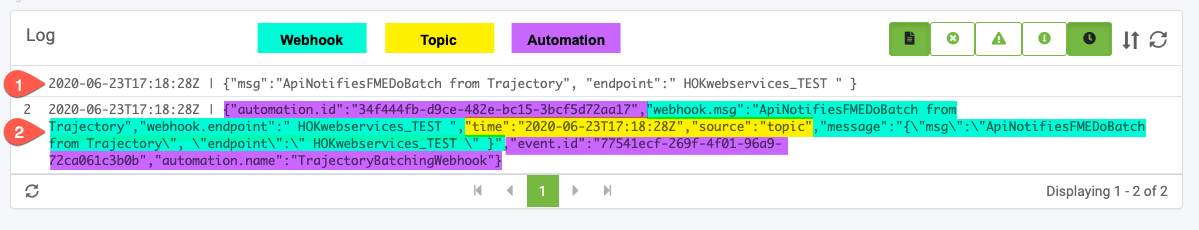
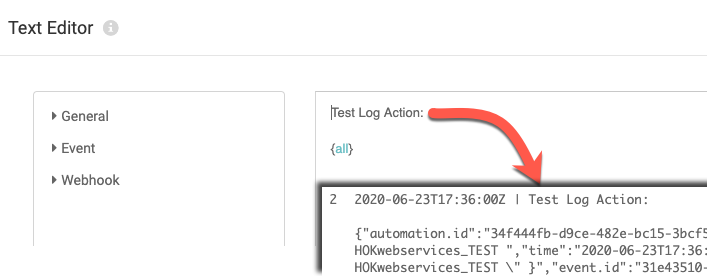
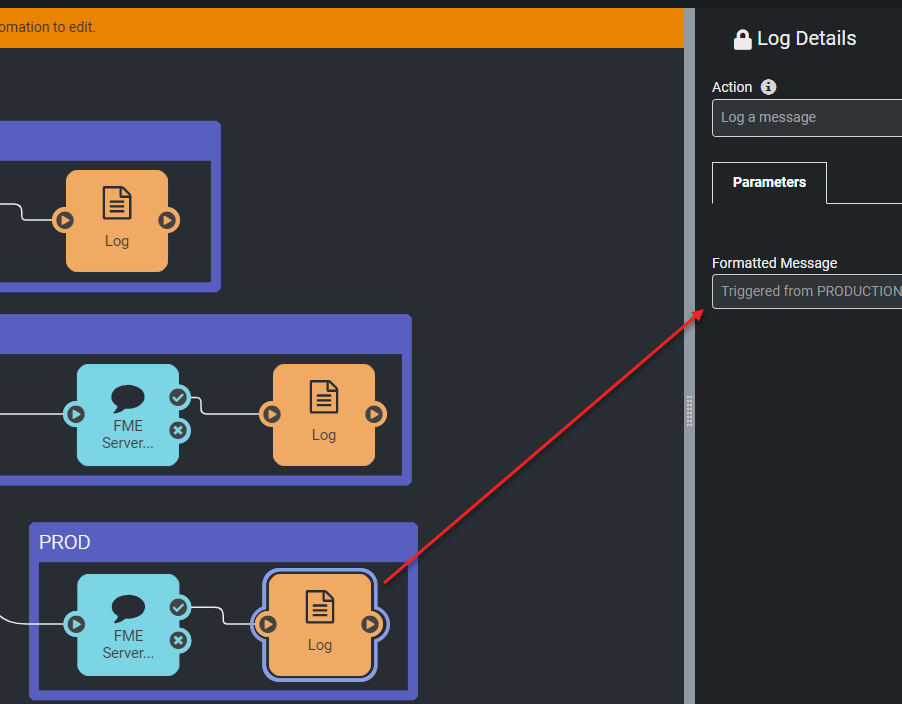
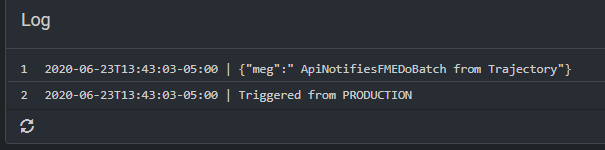
So I've been experimenting with this automation where an external application triggers a webhook and passes a message. I then filter the content by looking for the existence of a string and then trigger a topic if found and also log it. If it fails, another filter is applied and another topic is triggered and logged. And finally the same happens with another topic if all filtering fails. The goal of the log at each stage was to help in debugging but I'm finding that ALL logs are identical and that was definitely not my expectation. Shouldn't log actions only work and store data if actually triggered through a connection? Or am I misunderstanding how the new log action works? This is in FME Server 2020.1 beta. Thanks.


11 replies

Badge +2

Hi @dbaldacchino1,

I would not expect anything to be reported in the log if no messages actually reach that log. I did a small test in 2020.1 b20567 and was not able to reproduce the behaviour you described.


Are you able to save this automation as a project, and provide a some samples of the information passed into the webhook that will pass/fail each filter? This will allow me to test your workflow exact workflow to try and reproduce this.

Also if you could include the Automation log this would also be helpful.

Badge +3

Hi @dbaldacchino1,

I would not expect anything to be reported in the log if no messages actually reach that log. I did a small test in 2020.1 b20567 and was not able to reproduce the behaviour you described.


Are you able to save this automation as a project, and provide a some samples of the information passed into the webhook that will pass/fail each filter? This will allow me to test your workflow exact workflow to try and reproduce this.

Also if you could include the Automation log this would also be helpful.

Hi @hollyatsafe, thanks for your reply. Attacherd is the Project that includes the automation and related topics. When the webhook is invoked, a message is passed such as the example below:

{"msg":"ApiNotifiesFMEDoBatch from Trajectory", "endpoint":" HOKwebservices_TEST " }

The filters are set up as follows (first one as an example) to look for a specific string. Thanks.

Badge +2

Hi @hollyatsafe, thanks for your reply. Attacherd is the Project that includes the automation and related topics. When the webhook is invoked, a message is passed such as the example below:

{"msg":"ApiNotifiesFMEDoBatch from Trajectory", "endpoint":" HOKwebservices_TEST " }

The filters are set up as follows (first one as an example) to look for a specific string. Thanks.

Hi @dbaldacchino1,

Thank you for providing this, I am still not able to reproduce your issue, or I've misunderstood the problem, so I'll first explain what I see.


Using the Automation with the webhook message provided I expect two Log Actions to be triggered:


When I view the Automations log, this is correct, only these two logs have been triggered. In the second log you have chosen to log the entire 'event as JSON'. This will therefore include all the Output Keys from any upstream trigger/action, as well as information about the Automation itself. You can find the Event Keys for each trigger/action by clicking on it and selecting the 'Output Keys' tab.

The Filter doesn't produce any output keys, and the topic keys are not very informative for this scenario, so currently all the logs will report very similar responses. The main tell for which log has been triggered is the webhook.endpoint.

Perhaps to make this easier to identify, you could use the text editor to include some predetermined text such as a header, as well as the event info, that differs for each Log to make it easier to quickly identify which log was triggered.


Please correct me if I'm wrong here but from the description my understanding was that in your case all logs are being triggered, e.g. you are seeing 4 messages printed when the webhook receives a message, and 3 of these are the same Event as JSON message repeated.

Badge +3

Hi @dbaldacchino1,

Thank you for providing this, I am still not able to reproduce your issue, or I've misunderstood the problem, so I'll first explain what I see.


Using the Automation with the webhook message provided I expect two Log Actions to be triggered:


When I view the Automations log, this is correct, only these two logs have been triggered. In the second log you have chosen to log the entire 'event as JSON'. This will therefore include all the Output Keys from any upstream trigger/action, as well as information about the Automation itself. You can find the Event Keys for each trigger/action by clicking on it and selecting the 'Output Keys' tab.

The Filter doesn't produce any output keys, and the topic keys are not very informative for this scenario, so currently all the logs will report very similar responses. The main tell for which log has been triggered is the webhook.endpoint.

Perhaps to make this easier to identify, you could use the text editor to include some predetermined text such as a header, as well as the event info, that differs for each Log to make it easier to quickly identify which log was triggered.


Please correct me if I'm wrong here but from the description my understanding was that in your case all logs are being triggered, e.g. you are seeing 4 messages printed when the webhook receives a message, and 3 of these are the same Event as JSON message repeated.

Thanks @hollyatsafe, my understanding would be exactly as you specify above. However it doesn't matter which log I open: I get the exact same content in all of them (currently 20 identical lines in all 4 log outputs, which does not make sense). I am available for a webex to demonstrate the issue as I think this could be a bug (I'm like 1-2 builds behind yours I believe). Or should I open a ticket?

To clarify further, I expect to see no logging via "DEV" because in my testing I have never triggered anything that should be filtered to that branch, yet the log shows the same content when opened via the "DEV" logger that is also available through all other loggers in the automation. Thanks.

Badge +2

Thanks @hollyatsafe, my understanding would be exactly as you specify above. However it doesn't matter which log I open: I get the exact same content in all of them (currently 20 identical lines in all 4 log outputs, which does not make sense). I am available for a webex to demonstrate the issue as I think this could be a bug (I'm like 1-2 builds behind yours I believe). Or should I open a ticket?

To clarify further, I expect to see no logging via "DEV" because in my testing I have never triggered anything that should be filtered to that branch, yet the log shows the same content when opened via the "DEV" logger that is also available through all other loggers in the automation. Thanks.

Hi @dbaldacchino1,

Yes I think a screenshare would be best - I'm on Live Chat this afternoon though so limited availability today. Could you create a case with 'ATTN Holly' in the subject and we can arrange a call for some time tomorrow if that works for you?

Badge +3

Hi @dbaldacchino1,

Thank you for providing this, I am still not able to reproduce your issue, or I've misunderstood the problem, so I'll first explain what I see.


Using the Automation with the webhook message provided I expect two Log Actions to be triggered:


When I view the Automations log, this is correct, only these two logs have been triggered. In the second log you have chosen to log the entire 'event as JSON'. This will therefore include all the Output Keys from any upstream trigger/action, as well as information about the Automation itself. You can find the Event Keys for each trigger/action by clicking on it and selecting the 'Output Keys' tab.

The Filter doesn't produce any output keys, and the topic keys are not very informative for this scenario, so currently all the logs will report very similar responses. The main tell for which log has been triggered is the webhook.endpoint.

Perhaps to make this easier to identify, you could use the text editor to include some predetermined text such as a header, as well as the event info, that differs for each Log to make it easier to quickly identify which log was triggered.


Please correct me if I'm wrong here but from the description my understanding was that in your case all logs are being triggered, e.g. you are seeing 4 messages printed when the webhook receives a message, and 3 of these are the same Event as JSON message repeated.

I must be misunderstanding something I suppose. My expectation is that each logger will display different pieces of information, and not an aggregate of everything. So I changed the output to just some simple text as follows (different for each branch):

If the webhook is triggered from the Production environment, the log is indeed displaying the following:

But it doesn't matter which logger I click on, the log contents display the same as per above. It's as if the log is stored globally for the entire automation (which I believe to be the case for this new version) but the log content can be authored by various loggers throughout the automation. Am I correct in that observation?

My expectation as an end user (which is similar to what I expect when inspecting output in workbench at each transformer) is to ONLY see the above data when I look at the logger contents through the "PROD" branch only. I would expect the other two loggers shown above (DEV & TEST) to contain no information. Isn't this what should happen? Thanks again @hollyatsafe!

Badge +2

I must be misunderstanding something I suppose. My expectation is that each logger will display different pieces of information, and not an aggregate of everything. So I changed the output to just some simple text as follows (different for each branch):

If the webhook is triggered from the Production environment, the log is indeed displaying the following:

But it doesn't matter which logger I click on, the log contents display the same as per above. It's as if the log is stored globally for the entire automation (which I believe to be the case for this new version) but the log content can be authored by various loggers throughout the automation. Am I correct in that observation?

My expectation as an end user (which is similar to what I expect when inspecting output in workbench at each transformer) is to ONLY see the above data when I look at the logger contents through the "PROD" branch only. I would expect the other two loggers shown above (DEV & TEST) to contain no information. Isn't this what should happen? Thanks again @hollyatsafe!

Aha @dbaldacchino1! Right I understand. The old log action was simply a fmw workspace, so you had to specify a filename/location for each log, meaning they would be separate. However the new Log Action has been built into to use core processes (as to not occupy an engine whilst logging) but it will simply write out any log messages to the Automation Log which lives in the FME Server database.

So when you select a Log Action and click on the 'Go to Logs' button it is essentially the same as clicking Menu > View Log File and then using the Log Action Filter (one of the buttons on top right of log). Therefore this will show any log messages from any log action within that Automation from the time it started running (the log is refreshed if you stop/start), so actually what you are seeing is by design in 2020+.

I can see how this could be confusing and differs from the old behaviour so I will file an enhancement request for this - I will update this thread with the tracking number once I've created it. Perhaps in support you could file an idea that I can link to this as well.

Badge +3

Aha @dbaldacchino1! Right I understand. The old log action was simply a fmw workspace, so you had to specify a filename/location for each log, meaning they would be separate. However the new Log Action has been built into to use core processes (as to not occupy an engine whilst logging) but it will simply write out any log messages to the Automation Log which lives in the FME Server database.

So when you select a Log Action and click on the 'Go to Logs' button it is essentially the same as clicking Menu > View Log File and then using the Log Action Filter (one of the buttons on top right of log). Therefore this will show any log messages from any log action within that Automation from the time it started running (the log is refreshed if you stop/start), so actually what you are seeing is by design in 2020+.

I can see how this could be confusing and differs from the old behaviour so I will file an enhancement request for this - I will update this thread with the tracking number once I've created it. Perhaps in support you could file an idea that I can link to this as well.

Thanks @hollyatsafe, I thought I was losing my mind :) I'll file an idea request and link back here. Also another thing I'm noticing which I find confusing is that if I stop and start the automation, the log seems to get re-set but if I download it, all the history from the first time the automation was was run is still there! It would make sense to have filter controls in the UI to clearly show the user that they're only seeing the current activity and perhaps expose a way to look through the entire timeline without forcing the log to be downloaded. I wasn't aware that all the log history was preserved until I downloaded the log. Thanks.

Badge +2

Thanks @hollyatsafe, I thought I was losing my mind :) I'll file an idea request and link back here. Also another thing I'm noticing which I find confusing is that if I stop and start the automation, the log seems to get re-set but if I download it, all the history from the first time the automation was was run is still there! It would make sense to have filter controls in the UI to clearly show the user that they're only seeing the current activity and perhaps expose a way to look through the entire timeline without forcing the log to be downloaded. I wasn't aware that all the log history was preserved until I downloaded the log. Thanks.

Hi @dbaldacchino1,

No your mind is still in tact! Interesting find on the Download log, I agree I also thought the log history was lost, so thats quite a confusing user experience. I have filed a few enhancements requests based on this conversation.

  1. FMESERVER-15096 - When selecting 'Go to Logs' only show messages from the selected log, not all in the Automation.
  2. FMESERVER-15098 - View full history in Web UI (filtering options)
  3. FMESERVER-15099 - download log only includes info from filters set

There is no guarantee any of these will go into the product, but I have added this post to them so that you will be notified if they are implemented. If you post ideas, please do share those links as well.

Badge +3

Hi @dbaldacchino1,

No your mind is still in tact! Interesting find on the Download log, I agree I also thought the log history was lost, so thats quite a confusing user experience. I have filed a few enhancements requests based on this conversation.

  1. FMESERVER-15096 - When selecting 'Go to Logs' only show messages from the selected log, not all in the Automation.
  2. FMESERVER-15098 - View full history in Web UI (filtering options)
  3. FMESERVER-15099 - download log only includes info from filters set

There is no guarantee any of these will go into the product, but I have added this post to them so that you will be notified if they are implemented. If you post ideas, please do share those links as well.

Thank you! At least now it's clear how it works in the current state :) Will still use the log as it's helpful when debugging.

Badge +2

Thank you! At least now it's clear how it works in the current state :) Will still use the log as it's helpful when debugging.

@dbaldacchino1,

Great! One last think I forgot to mention is if you preferred the older style Log Action (pre-2020) this is still available. To set this up use the Run Workspace Action, Repository = Tools and Workspace = LogMessage. The caveat being that they are taking up an engine as it's simply a workspace.

Reply