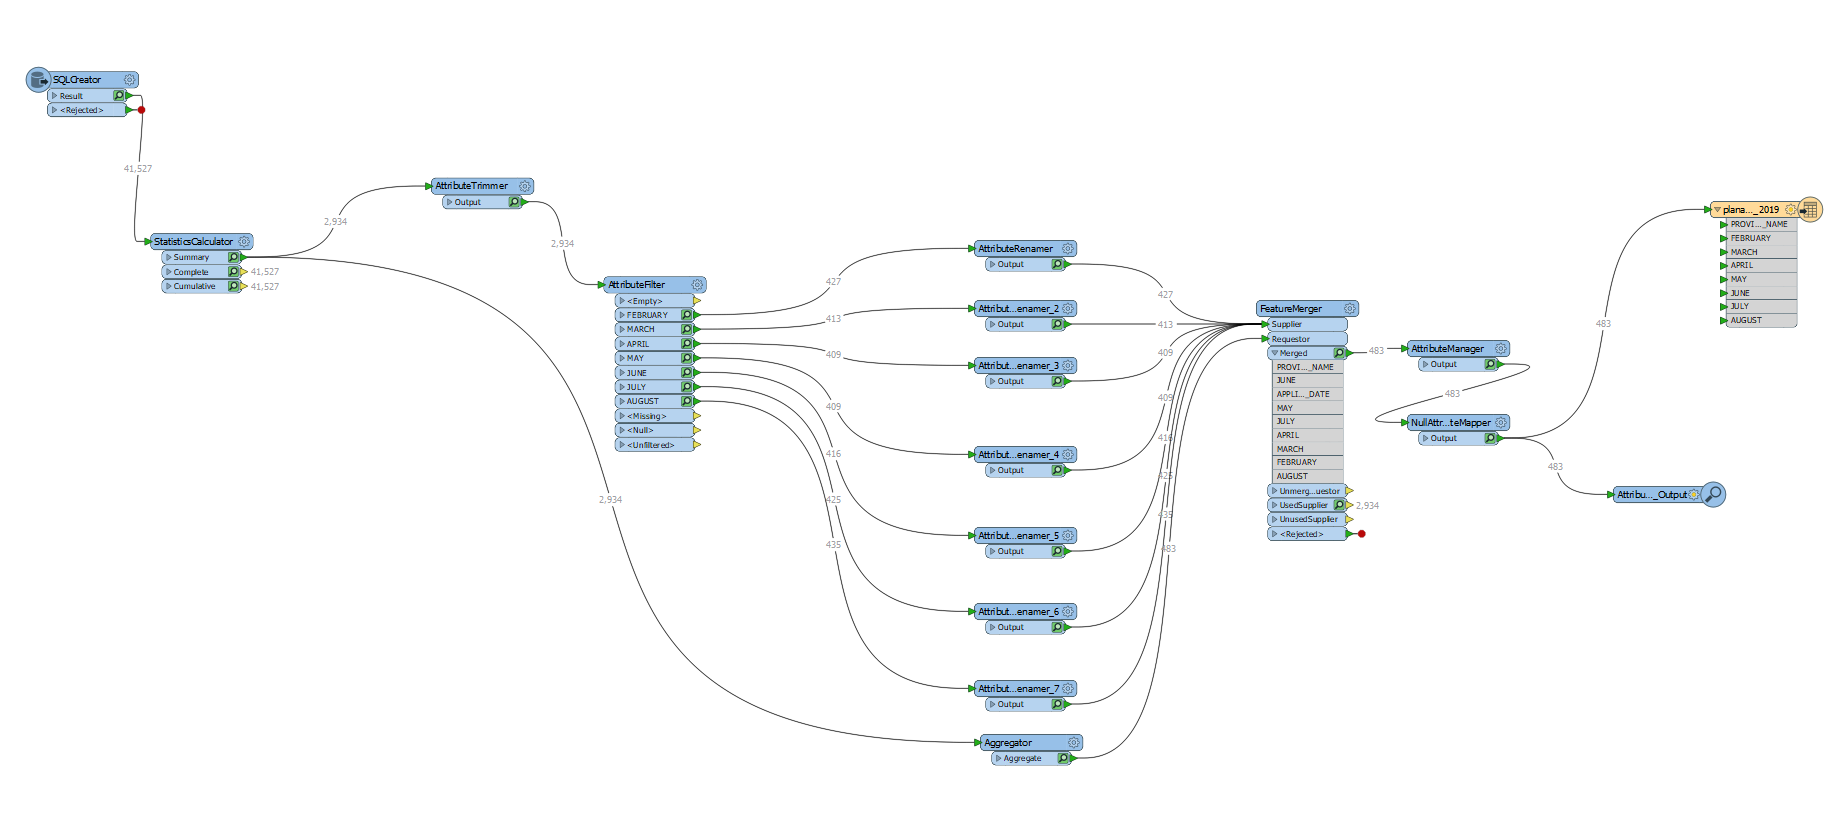
I have a dataset where features contain two attributes - Month and Provider. What I want to do is create a table wherein the Months of Feb to Aug inclusive run along one axis, Provider along the other and the cell contents are a count of occurrences of features per Provider in each month.
I've achieved this using a fairly roundabout method - which was ok given that the range of variables was fairly small; however, I can't help but feel that there is a simpler way, presumably using StatisticsCalculator or AttributePivoter...?


