Question

Setting ChartGenerator bar colour from attributes


Badge

I have a summary table of collection routes and the number of collection points on each route. Each route gets a colour value based on the number of collection points (grouped into bands of 100). I'm routing this into the ChartGenerator and using my "fill_colour" attribute to colour each bar on the chart.

I have seven bands in my dataset and I'm expecting to see 7 different colours on the chart but instead I seem to get a default blue colour.

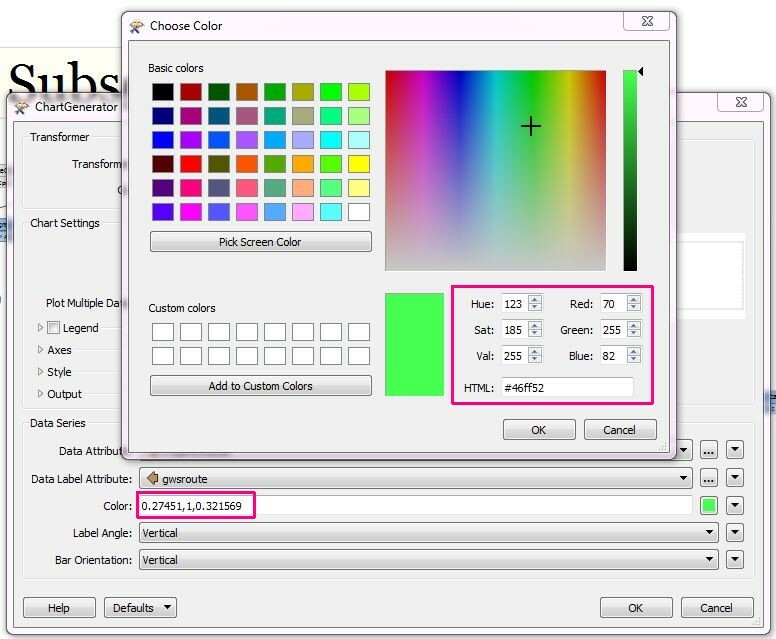
My fill_colour field has values like 65,174,118 just as recommended in the help file. I've tried with and without quotes and can't get my specified colours.

Any suggestion? Am I asking too much of the ChartGenerator?


3 replies

Badge
This question and answer (https://gis.stackexchange.com/questions/189609/conditional-styling-in-fme-chartgenerator) seems to indicate that I am doing the right thing but the chart generator is not honouring my pleas for different colours.


Badge
OK - cracked this myself. The RGB string needs the values to be in the range (0-1, 0-1, 0-1) rather than (0-255, 0-255, 0-255).


Clicking the colour picker button displays the HSV, RGB and HTML HEX codes for the colours but after choosing your colour it populates the field with the (0-1, 0-1, 0-1) values.


Reply