Question

Create multiple data series from attributes?

  • 12 September 2016
  • 3 replies
  • 18 views

I am new to FME, so please accept my apologies if this is a confusing or stupid question!

I have a CSV file containing weather model data, specifically tropical storms and their associated intensity (max wind speed) forecasts at 6-hour intervals.

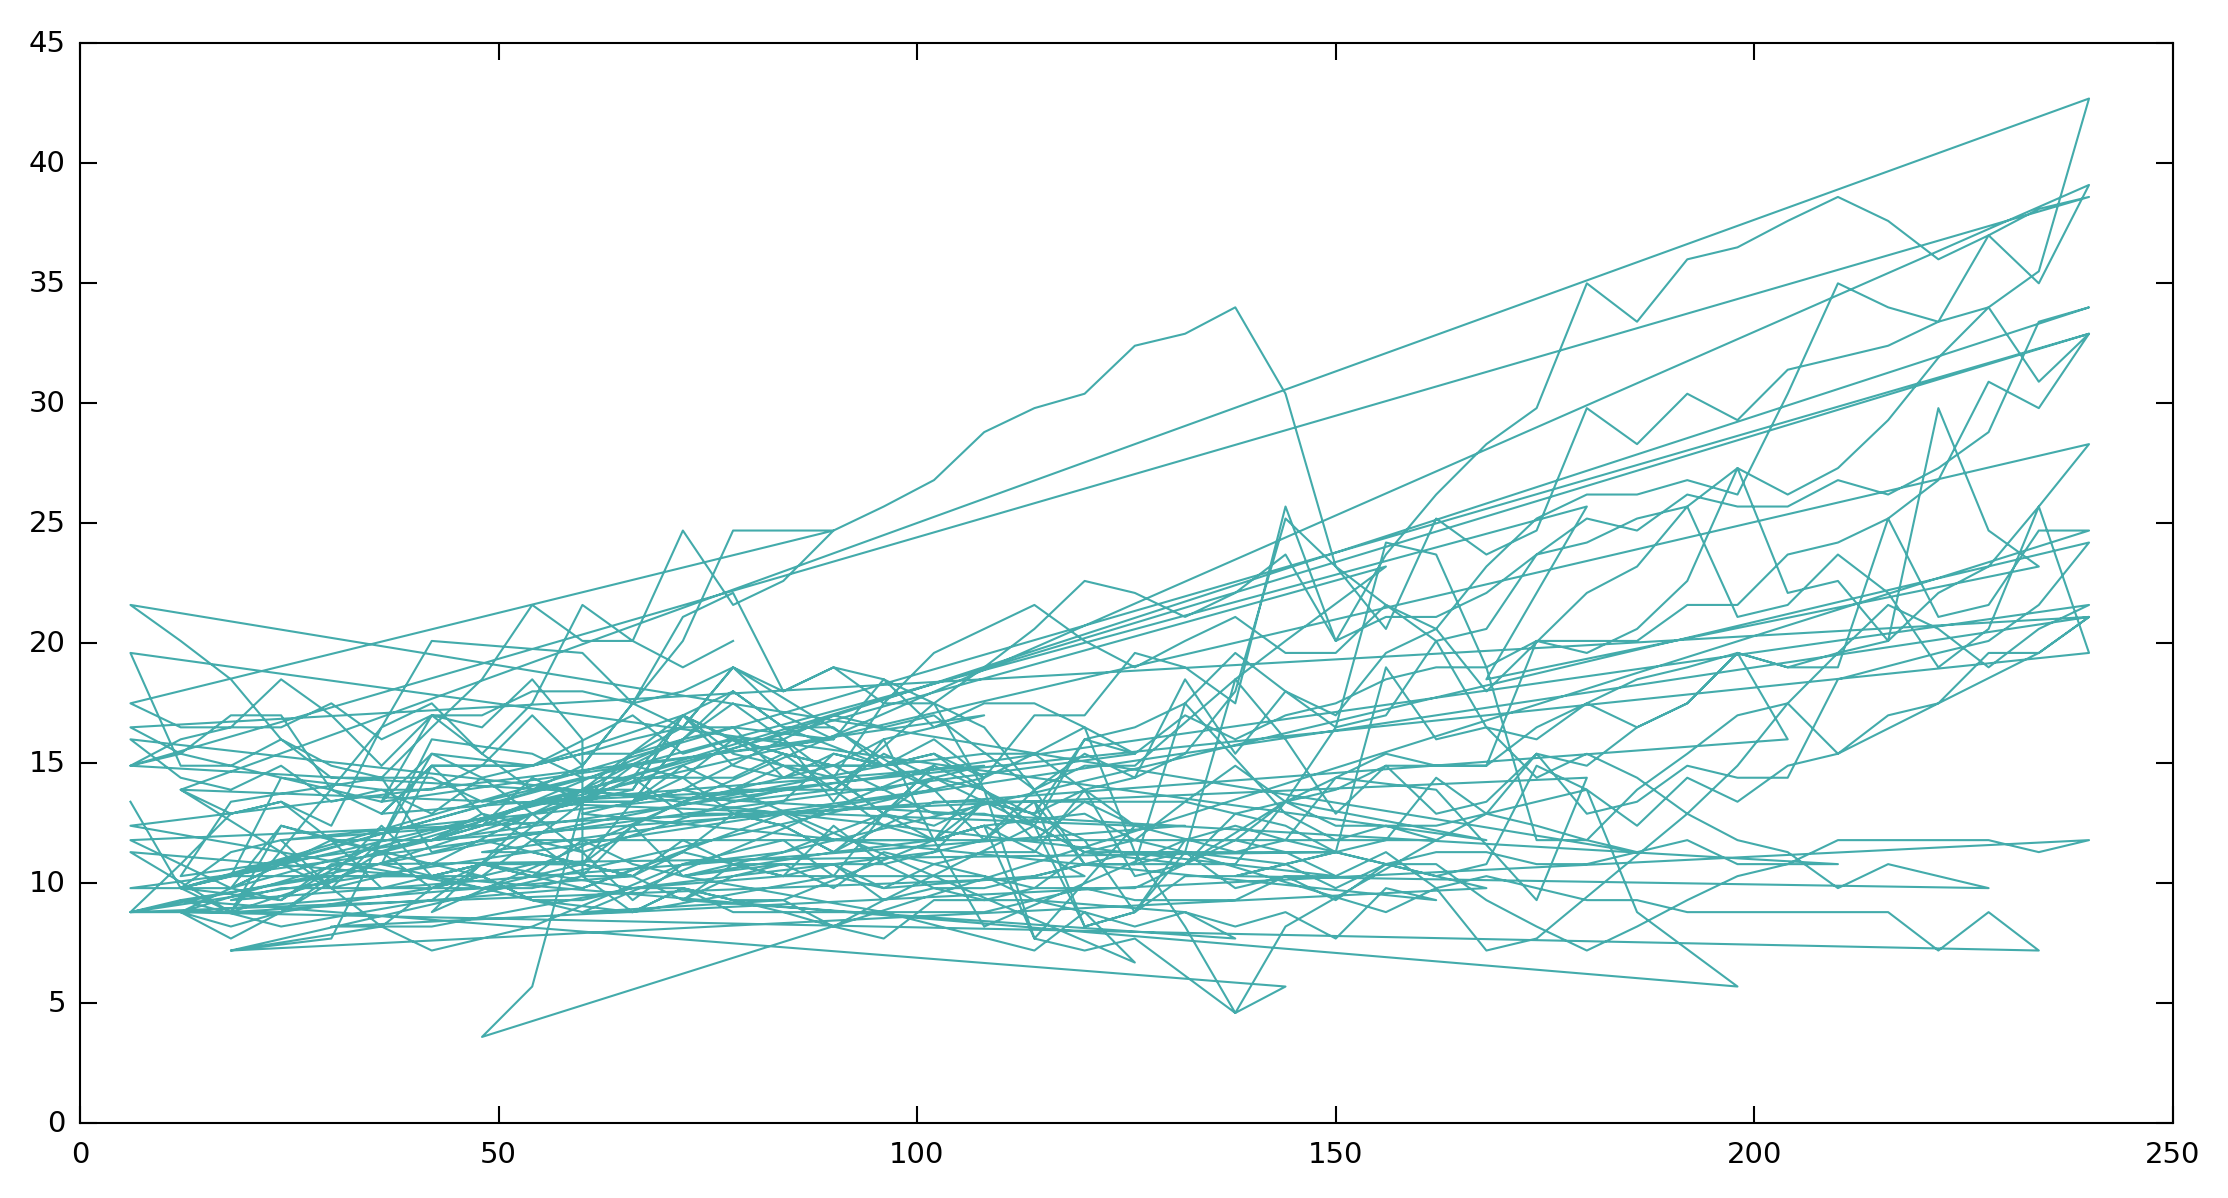
Each storm ID has a set of "member numbers" which refers to a perturbation of the weather model to produce a range of outcomes. What I want to do with this data is plot a time series of each member_number (line chart) showing time_step on the x-axis and max_wind on the y-axis, for each stormID. So in the example data, I want one chart for StormID "16W" with lines for each member number (1 to 52) showing wind speed over time, another chart for StormID "70W" and so on... The goal is for it to look something like this (this is a different data set, just using it as an example for the look I'm after)...

This is my first time using ChartGenerator, and I was able to make the chart below, but it takes every member_num as one continuous series rather than showing 52 separate lines. I see the option to plot multiple data series under parameters in ChartGenerator, but am not sure how this will help me do what I need to do. I will eventually need to figure out how to randomly color the lines, but for now I'll be happy just to separate them!


3 replies

Badge +22

To plot your members IDs separately, you need to consolidate your data.


Instead of having a separate feature for each member number, you need to have different attributes on the same feature.


Ex.


Storm: 16W


Time: 2


52_Wind: 45.3


83_Wind: 31.6


42_Wind: 37.6


---


Storm: 16W


Time: 4


52_Wind: 51.2


83_Wind: 33.7


42_Wind: 34.6


Then you can use multiple data series.

Thanks jdh- I think I understand what you are showing here.... but not sure how to go about consolidating the data like you have. Would I build a list or create new attributes? My apologies again as I am a newbie here. I've been playing with lists but when I get to the ChartGenerator transformer, I am confused as to what to group by and whether to use list items as X and Y attributes or something else...

Badge +22

Thanks jdh- I think I understand what you are showing here.... but not sure how to go about consolidating the data like you have. Would I build a list or create new attributes? My apologies again as I am a newbie here. I've been playing with lists but when I get to the ChartGenerator transformer, I am confused as to what to group by and whether to use list items as X and Y attributes or something else...

I used a BulkAttributeRenamer, Aggregator and AttributeExposer. You will have to manually expose the new attribute names in order to use them in the ChartGenerator.


Reply