Hi,
I want to find local low point in the point cloud. It is to bring out possible locations for water accumulation. Does anyone know a solution to this problem?
Best answer by dmitribagh
View original
Hi,
I want to find local low point in the point cloud. It is to bring out possible locations for water accumulation. Does anyone know a solution to this problem?
Best answer by dmitribagh
View original

 +16
+16
What do you mean by low point? is it the point with the lowest Z value?
What do you mean by low point? is it the point with the lowest Z value?
I mean point with the lowest z value comparing with neighbour points. In an area there can be many low points.
+16
You could try the PointCloudStatisticsCalculator to calculate the min z value, can you elaborate on what you are trying to achieve?
You could try the PointCloudStatisticsCalculator to calculate the min z value, can you elaborate on what you are trying to achieve?
Want to find low point in one terrain to identify possible point of water accumulation.

 +25
+25
I think that's going to be quite tough to do, and especially with a point cloud. Although I still can't think of a definite solution, I think that if you converted it (maybe to a DEM or even a Raster DEM) using the SurfaceModeller, then it might be easier to find a solution.
For example, maybe get the output as contours and then do a nearest neighbor to see if there is a lower contour. If not, then that is your low point. Or get DEM points and do a nearest neighbor. Basically you are looking for any Z value that doesn't neighbor a lower Z value.
Once you have the information I'm sure you could transfer it back to the point cloud if you needed, or clip out the low parts of the point cloud.
Hope this helps to get you started.

 +22
+22
Based off of @takashi raster solution to the game of life challenge, I came up with something that seems to work localmin.fmw
Essentially convert to dem, offset by a pixel in all directions and recombine to end up with a 9 band raster where each pixel contains the original value and that of the 8 neighbouring cells. Conditional expression to determine pixels that are the local low.

 +11
+11
Hi, @laila72
This is actually quite easy. We talked about this scenario in our point cloud webinar and have an example online.
The idea is to compare all the points within a chosen tolerance and pick the lowest one.
To achieve that we do the following:
1) copy the original x and y components to some temp components: x_orig, y_orig (PointCloudComponentCopier)
2) Round the x and y values to the tolerance with PointCloudExpressionEvaluator.
For example if the tolerance is 20, then, to round x=105 to closest factorable number, use the following expression:
@floor(@Component(x)/20)*20
3) Sort points by Z ascendingly (PointCloudSorter)
4) Merge point cloud with itself (send it to both Requestor and Supplier ports of PointCloudMerger) by x and y. This will lead to creation of columns of points spaced by tolerance. The point at the bottom of each column will be the local minimum. To get it, use the output from Referenced port.
5) From here, there are many possibilities to continue. For example, we can add a flag component to the points indicating whether it's local minimum or not. We can preserve the local min xy on all other points (x_local_min, y_local_min) and restore the original x and y (PointCloudComponentCopier) etc.
Here is the link to the webinar page, which has the recording, the slides and the workspaces:
http://www.safe.com/webinars/how-to-get-the-most-out-of-lidar-data/#
Dmitri
Hi and thank you all for very good advice. I have solved my problem by Dimitri their proposals. After finding low point in 10m grid I used Buffer and SpatialRelator to find neighbour point. So I used Tester to find what point having a lower z value than all neighboring point.
Have a nice day :-)
Laila

 +6
+6
Based off of @takashi raster solution to the game of life challenge, I came up with something that seems to work localmin.fmw
Essentially convert to dem, offset by a pixel in all directions and recombine to end up with a 9 band raster where each pixel contains the original value and that of the 8 neighbouring cells. Conditional expression to determine pixels that are the local low.
Hi @jdh
I am looking for an FME-based method for detecting local minima (pits and topographic depressions) on a large DEM. The 9 band raster approach is interesting and was wondering if you still had this "localmin.fmw" in your archives. I suppose you are using a RasterExpressionEvaluator for defining the expression allowing the detection of local low pixel values. I was also wondering how it behaves if the bottom of the pit or depression is made up of multiple adjacent pixels with the same value. Otherwise, the workspace of the "game of life challenge" could also offer me some inspiration but I am not finding it online either.
Thanks!
Olivier
+22
Hi @jdh
I am looking for an FME-based method for detecting local minima (pits and topographic depressions) on a large DEM. The 9 band raster approach is interesting and was wondering if you still had this "localmin.fmw" in your archives. I suppose you are using a RasterExpressionEvaluator for defining the expression allowing the detection of local low pixel values. I was also wondering how it behaves if the bottom of the pit or depression is made up of multiple adjacent pixels with the same value. Otherwise, the workspace of the "game of life challenge" could also offer me some inspiration but I am not finding it online either.
Thanks!
Olivier
You are in luck.
+6
Hi @jdh
I am looking for an FME-based method for detecting local minima (pits and topographic depressions) on a large DEM. The 9 band raster approach is interesting and was wondering if you still had this "localmin.fmw" in your archives. I suppose you are using a RasterExpressionEvaluator for defining the expression allowing the detection of local low pixel values. I was also wondering how it behaves if the bottom of the pit or depression is made up of multiple adjacent pixels with the same value. Otherwise, the workspace of the "game of life challenge" could also offer me some inspiration but I am not finding it online either.
Thanks!
Olivier
Thank you so much @jdh ! This is really helpful and inspiring. I will build from that logic and see if I can enhance it further for deriving pit depth for the complete depression or sink volume (most local minima correspond to small surface irregularities and may be discarded). I first want to see if can solve this in raster or point cloud mode, before relying to vector contour lines analysis (which will probably be slower).
Hi and thank you all for very good advice. I have solved my problem by Dimitri their proposals. After finding low point in 10m grid I used Buffer and SpatialRelator to find neighbour point. So I used Tester to find what point having a lower z value than all neighboring point.
Have a nice day :-)
Laila
can you share the workspace with me pls
Hi, sorry my late answer - but the workspace is gone . I have not worked with this issue in many years. Sorry and good luck :-)
Laila
Hi, sorry my late answer - but the workspace is gone . I have not worked with this issue in many years. Sorry and good luck :-)
Laila
ooh okay, thanks for replying
Hi, @laila72
This is actually quite easy. We talked about this scenario in our point cloud webinar and have an example online.
The idea is to compare all the points within a chosen tolerance and pick the lowest one.
To achieve that we do the following:
1) copy the original x and y components to some temp components: x_orig, y_orig (PointCloudComponentCopier)
2) Round the x and y values to the tolerance with PointCloudExpressionEvaluator.
For example if the tolerance is 20, then, to round x=105 to closest factorable number, use the following expression:
@floor(@Component(x)/20)*20
3) Sort points by Z ascendingly (PointCloudSorter)
4) Merge point cloud with itself (send it to both Requestor and Supplier ports of PointCloudMerger) by x and y. This will lead to creation of columns of points spaced by tolerance. The point at the bottom of each column will be the local minimum. To get it, use the output from Referenced port.
5) From here, there are many possibilities to continue. For example, we can add a flag component to the points indicating whether it's local minimum or not. We can preserve the local min xy on all other points (x_local_min, y_local_min) and restore the original x and y (PointCloudComponentCopier) etc.
Here is the link to the webinar page, which has the recording, the slides and the workspaces:
http://www.safe.com/webinars/how-to-get-the-most-out-of-lidar-data/#
Dmitri
@dmitribagh Hey i want to do something like this. I want to find all the spots of possible waterlogging. Where water can not run off and stored at one place. Mainly focusing on roads in a city. Can you pls help me with this. Result i want is a polygon or point shape file with spots where water log happens.
+11
@dmitribagh Hey i want to do something like this. I want to find all the spots of possible waterlogging. Where water can not run off and stored at one place. Mainly focusing on roads in a city. Can you pls help me with this. Result i want is a polygon or point shape file with spots where water log happens.
Hi @ladisrikanta123 ,
I can have a look, but I need more info - what is your source data and what are the spots of waterlogging. Feel free to share the details here or contact me directly at dmitri@safe.com
Dmitri
@dmitribagh Hey i want to do something like this. I want to find all the spots of possible waterlogging. Where water can not run off and stored at one place. Mainly focusing on roads in a city. Can you pls help me with this. Result i want is a polygon or point shape file with spots where water log happens.
@dmitribagh Hello, Thanks actually the data i can not share due to some security reason. But i just want to create an workspace which will identify all the areas where possible waterlog can happen. i have a terrain and point cloud data.
@dmitribagh Hey i want to do something like this. I want to find all the spots of possible waterlogging. Where water can not run off and stored at one place. Mainly focusing on roads in a city. Can you pls help me with this. Result i want is a polygon or point shape file with spots where water log happens.
@dmitribagh Hey i want to do something like this. I want to find all the spots of possible waterlogging. Where water can not run off and stored at one place. Mainly focusing on roads in a city. Can you pls help me with this. Result i want is a polygon or point shape file with spots where water log happens.
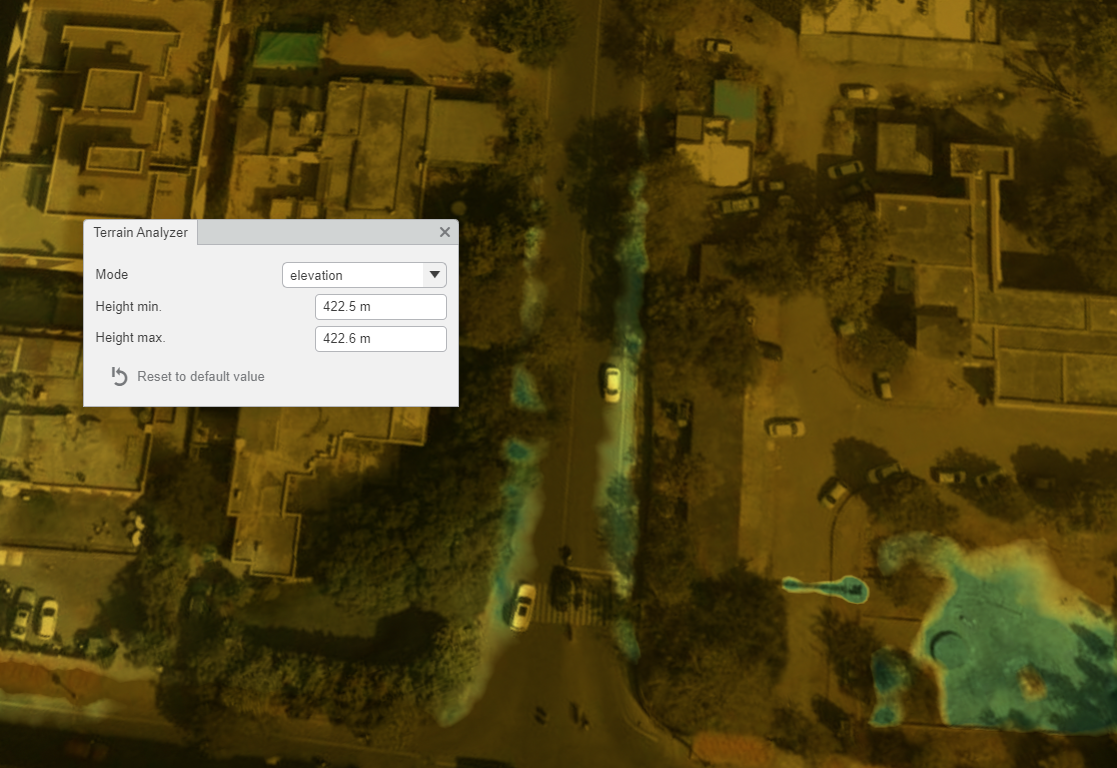
like this it should show the spots where the terrain is low compare to neighbor terrain at high level causing water to stay there without flowing on slope
+11
@dmitribagh Hey i want to do something like this. I want to find all the spots of possible waterlogging. Where water can not run off and stored at one place. Mainly focusing on roads in a city. Can you pls help me with this. Result i want is a polygon or point shape file with spots where water log happens.
Hi @ladisrikanta123 ,
It is quite easy to find local low points of a point cloud in a regular grid - say, find lowest point in squares 5 by 5 meters. I can refer to my workspace in the webinar mentioned above (and here - http://www.safe.com/webinars/how-to-get-the-most-out-of-lidar-data/#). Download the workspace, round point cloud coordinates to the necessary grid size and you'll get the lowest (or highest - depending on sorting) points in the grid.
Extracting low zones like your image shows seems to be a bit more difficult. I experimented a bit with RasterConvolver and RasterExpressionEvaluator on a city DEM, and got some promising results, but I don't feel like this solution is entirely correct (although a lot of visual checks showed correct the detection worked). The idea is to make a ring around each pixel of a DEM and see whether the lowest elevation in the ring is above the elevation of the pixel. If yes, than it is a local depression. Check this video - I changed the parameter from 5 pixels to 151 pixels (or meters, as it is a 1m DEM), and this allowed me to find depressions of different sizes - https://www.dropbox.com/s/99qyyn6fth1sum6/depressions.mp4?dl=0.
Just to make sure it really worked, in my workspace, I labelled all the DEM pixels in such depressions and around them. I also used some smoothing for the depressions just to make them look nice. I think, it also should be possible to add some coloring to show the depth, but I didn't think how exactly it can be done. So, have a look, let me know what you think, and maybe this will inspire you to find a better way of detecting such areas:
https://www.dropbox.com/s/g19bh8ml58zskgz/DEMDepressions.fmwt?dl=0
Enter your username or e-mail address. We'll send you an e-mail with instructions to reset your password.