Question

Chartgenerator: plotting attributefields with missing values


I'm trying to create a bunch of graphs where data comes from different data sources. As a consequence the length of the attributefields differ (i.e. some fields are missing when constructing fields af the same length). What I would like to plot is x against y and x against y_incomplete in 1 graph:

x


y


y_incomplete


1


1


<missing>


2


3


3


3


6


7


4


9


<missing>


5


12


4


6


15


8


However, this raises the error:

ChartGenerator: Non-numeric input provided. Please validate that the values of the "X Attribute","Y Attribute" and "Error Attribute" (if supplied) are numeric

ChartGenerator_2(PythonFactory): PythonFactory failed to close properly

ChartGenerator_2(PythonFactory): A fatal error has occurred. Check the logfile above for details

A fatal error has occurred. Check the logfile above for details


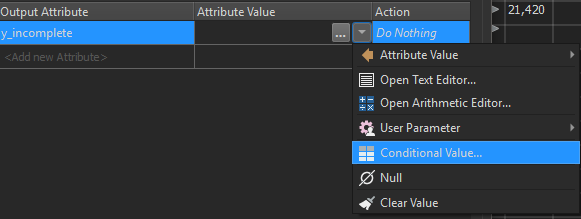
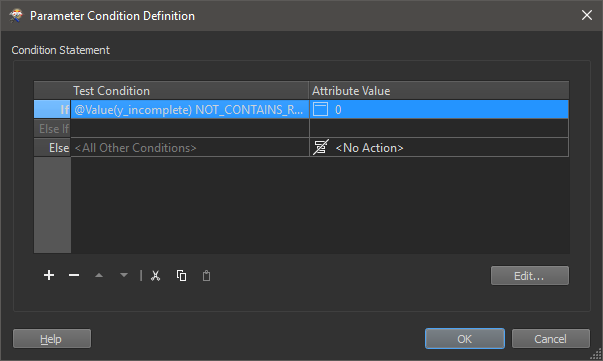
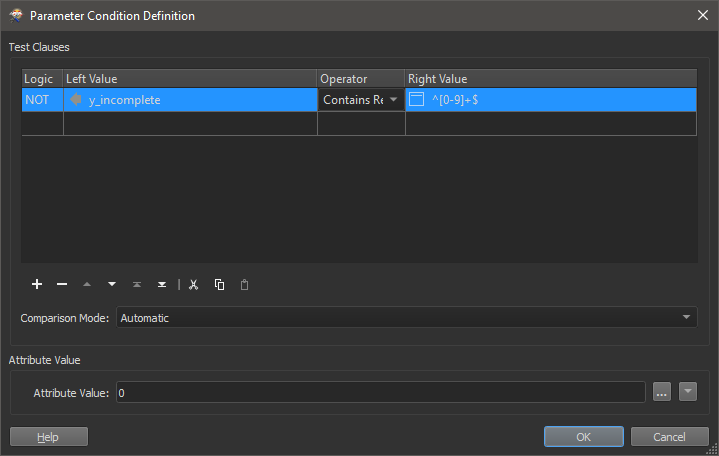
It would be nice if the chartgenerator could handle missing data or in the settings you could set a no data value. Or am I missing something and is the chartgenerator already able to do this?


7 replies

Badge +2

It sounds like the y_incomplete just needs some fake integer. You could add an attribute manager before the Chartgenerator that has conditional values for y_incomplete. You could force a non-numeric value in y_incomplete to default to 0 like this:

Add an attributemanager before the Chartgenerator, and add a conditional value to y_incomplete.

Double click on the If Test Condition to add a test for missing y_incomplete values.

The test condition should look something like this. You can choose a numeric value to make this compatible with the Chartgenerator.


I hope this is what you're looking for and it helps.

Hi Bruttino, thanks for your answer. However, this is no the solution I'm looking for. When converting all non-numeric values to a fake integer like 0, the line will be plotted through zero. In the example posted by myself I would like to have only a line at x coordinates 2 and 3 - and at x coordinates 5 and 6. In between no line should be plotted.

Badge +22

If you don't want to plot the missing values, why not use a tester to filter them out before hand, and only send those features with valid values to the chartGenerator.

If you don't want to plot the missing values, why not use a tester to filter them out before hand, and only send those features with valid values to the chartGenerator.

Hi jdh, thanks for your answer. I would like to plot multiple dataseries in 1 graph. As far as I know can the chart generator only handle dataseries of the same length. Using a tester will result in unequal length, i.e. chartgenerator raises an error. In the ideal world I like to plot y_incomplete, which results at in a line between between x= 2 and x= 3 and a line between x = 5 and x=6, where there is no data.

The case I'm working on is to generate profile of multiple rasters dems of multiple years. Whereas some data on a profile could be missing.

Badge +22

Hi jdh, thanks for your answer. I would like to plot multiple dataseries in 1 graph. As far as I know can the chart generator only handle dataseries of the same length. Using a tester will result in unequal length, i.e. chartgenerator raises an error. In the ideal world I like to plot y_incomplete, which results at in a line between between x= 2 and x= 3 and a line between x = 5 and x=6, where there is no data.

The case I'm working on is to generate profile of multiple rasters dems of multiple years. Whereas some data on a profile could be missing.

Hmm.


What about using the RCaller and creating the scatter plot there?


Alternatively you could use the plotly library in python. Note that it's not installed by default.

Hmm.


What about using the RCaller and creating the scatter plot there?


Alternatively you could use the plotly library in python. Note that it's not installed by default.

Thanks for the suggestion, maybe that's the way to go for more complicated plots. I'll look into that!

Badge +22

Thanks for the suggestion, maybe that's the way to go for more complicated plots. I'll look into that!

I suggest you post an idea to improve the chartGenerator to more gracefully handle missing/null values.


IMO it should either replace them with a default value (not relevant in your case), or reject the feature (not plot it) without causing a fatal error.


The default value should be per dataseries.


There should be an option as to whether the rejected feature should be per feature, or per dataseries. (ie if one value is missing, should the other dataseries include values from that feature or not).

Reply