I am trying to make a chart with XY coordinates generated from the Profile Generator. I have two inputs and trying to plot both on the same chart with different color. I can run with one dataset, but when I try to run with data series it gives me this error: ChartGenerator: Non-numeric input provided. Please validate that the values of the "X Attribute","Y Attribute" and "Error Attribute" (if supplied) are numeric.


Userlevel 4
 +30
+30
- Evangelist
- 1874 replies
-
6 November 2018

Hi @tbs_gis_team
Could you share us the Workspace or print?
And the full Log file?
Thanks,
Danilo


Userlevel 6
 +32
+32
- Celebrity
- 2337 replies
-
6 November 2018

This is probably caused by a space in the attribute name of the data you use to generate the chart. See
https://knowledge.safe.com/questions/59906/chartgenerator-fatal-error-non-numeric-input-provi.html
No space in the name, I have two datasets and I can run each separately. It gives the error when I try to run in the chart generator with multiple data series enabled.
chart_generator.zip
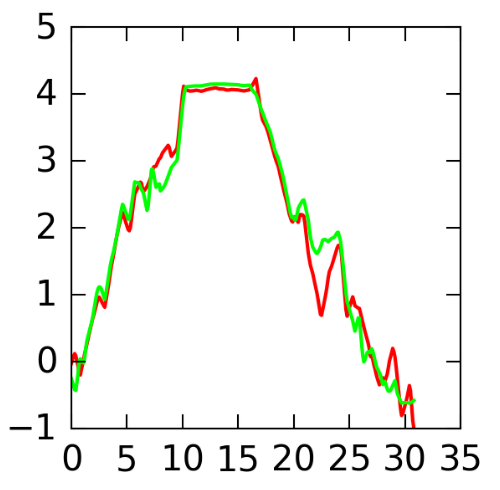
I attached a simplified version of what I am trying to build. It is basically two csv files with XY values generated with the profile generator. I made sure they have the same amount of X values so they plot the Y on the same X for the chart. The end result is I want each line on one chart with different color.
Chad

 +2
+2
- Safer
- 327 replies
-
6 November 2018

Hi @tbs_gis_team, I had a look at your data, and workspace. I was momentarily confused by the error as well, then realized why this was happening:
By routing both data stream after the AttributeCreator into the ChartGenerator, we've created a dataset where only some records have attributes x2 and y2 (because they are only created on the second stream). Now when a record without the x2 and y2 attributes goes into ChartGenerator, the x2 y2 values are missing, therefore not numeric.
One idea I can think of to make this work, is to use a FeatureJoiner before the ChartGenerator, to combine the two data streams, so that all records will have both x y, and x2 y2 attributes. Can you give that a try?
Tip: You may need to use generate a count attribute, with the Counter transformer (make sure to set the scope to local), on both streams to act as the attribute to join on.
Here is the screenshot of the suggested workflow. 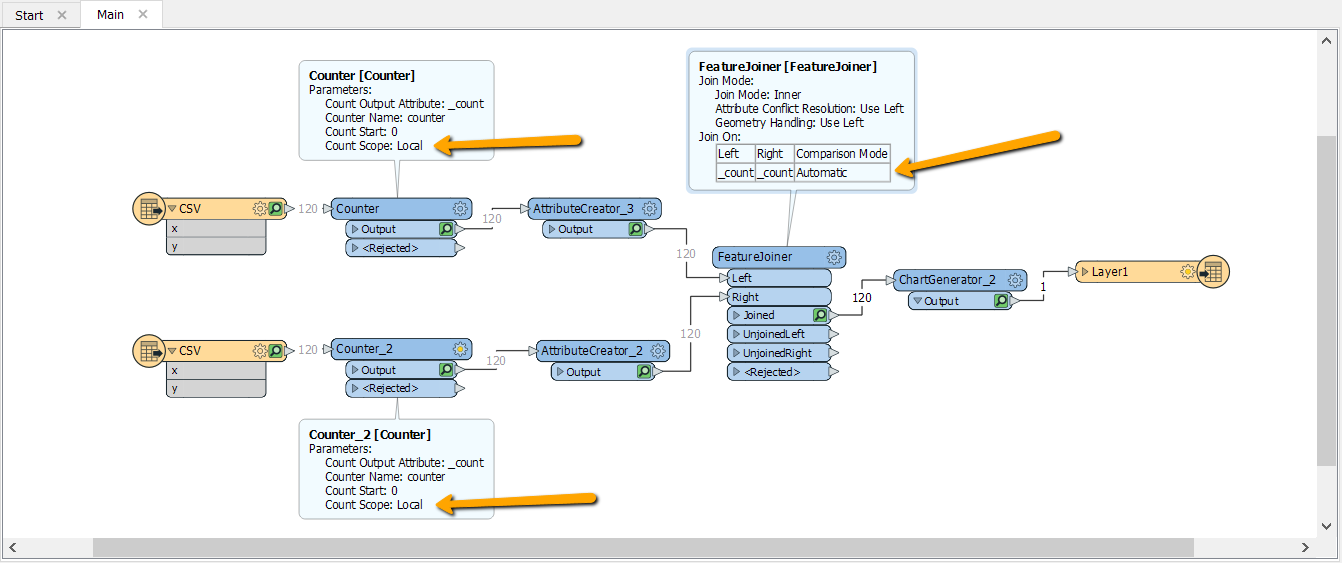
Hi @tbs_gis_team, I had a look at your data, and workspace. I was momentarily confused by the error as well, then realized why this was happening:
By routing both data stream after the AttributeCreator into the ChartGenerator, we've created a dataset where only some records have attributes x2 and y2 (because they are only created on the second stream). Now when a record without the x2 and y2 attributes goes into ChartGenerator, the x2 y2 values are missing, therefore not numeric.
One idea I can think of to make this work, is to use a FeatureJoiner before the ChartGenerator, to combine the two data streams, so that all records will have both x y, and x2 y2 attributes. Can you give that a try?
Tip: You may need to use generate a count attribute, with the Counter transformer (make sure to set the scope to local), on both streams to act as the attribute to join on.
Here is the screenshot of the suggested workflow.
Did it print both lines in your process? I will give it a try...Thanks Chad
Hi @tbs_gis_team, I had a look at your data, and workspace. I was momentarily confused by the error as well, then realized why this was happening:
By routing both data stream after the AttributeCreator into the ChartGenerator, we've created a dataset where only some records have attributes x2 and y2 (because they are only created on the second stream). Now when a record without the x2 and y2 attributes goes into ChartGenerator, the x2 y2 values are missing, therefore not numeric.
One idea I can think of to make this work, is to use a FeatureJoiner before the ChartGenerator, to combine the two data streams, so that all records will have both x y, and x2 y2 attributes. Can you give that a try?
Tip: You may need to use generate a count attribute, with the Counter transformer (make sure to set the scope to local), on both streams to act as the attribute to join on.
Here is the screenshot of the suggested workflow.
Thanks Xiaomeng, that did the trick...
I am having another issue now. I was using the two csv files created from two dem files to use as test data for the chart generator process. My end goal was to have a process that you could import two or more DEM files and create profiles for both and then create a chart in the generator for export. I am having an issue with the process only processing one DEM file and writing out its profile to the chart generator. I have tried feature holders, importing DEM files as two readers and also importing together and splitting by fme basename. If I can't bring both into one process I was thinking a workspace runner to run one DEM then the other and merge the profile values to run in the chart generator.
Thanks,
Chad
Userlevel 6
+32
- Celebrity
- 2337 replies
-
13 November 2018
I am having another issue now. I was using the two csv files created from two dem files to use as test data for the chart generator process. My end goal was to have a process that you could import two or more DEM files and create profiles for both and then create a chart in the generator for export. I am having an issue with the process only processing one DEM file and writing out its profile to the chart generator. I have tried feature holders, importing DEM files as two readers and also importing together and splitting by fme basename. If I can't bring both into one process I was thinking a workspace runner to run one DEM then the other and merge the profile values to run in the chart generator.
Thanks,
Chad
I think you still got the same problem: you need one feature with two values to plot two lines in one chart:
Distance (x)ValueDem1 (y serie 1)ValueDem2 (y serie 2)00.00.511.01.521.01.0
Where you might have:
Distance (x)ValueDem1 (y serie 1)
ValueDem2 (y serie 2)
00.0
0
0.5
11.0
1
1.5
21.0
2
1.0
I think you still got the same problem: you need one feature with two values to plot two lines in one chart:
Distance (x)ValueDem1 (y serie 1)ValueDem2 (y serie 2)00.00.511.01.521.01.0
Where you might have:
Distance (x)ValueDem1 (y serie 1)
ValueDem2 (y serie 2)
00.0
0
0.5
11.0
1
1.5
21.0
2
1.0
It will not get to the chart generator. Once one DEM goes through the profile generator the second one stops at the profile generator it is linked to and the process finishes..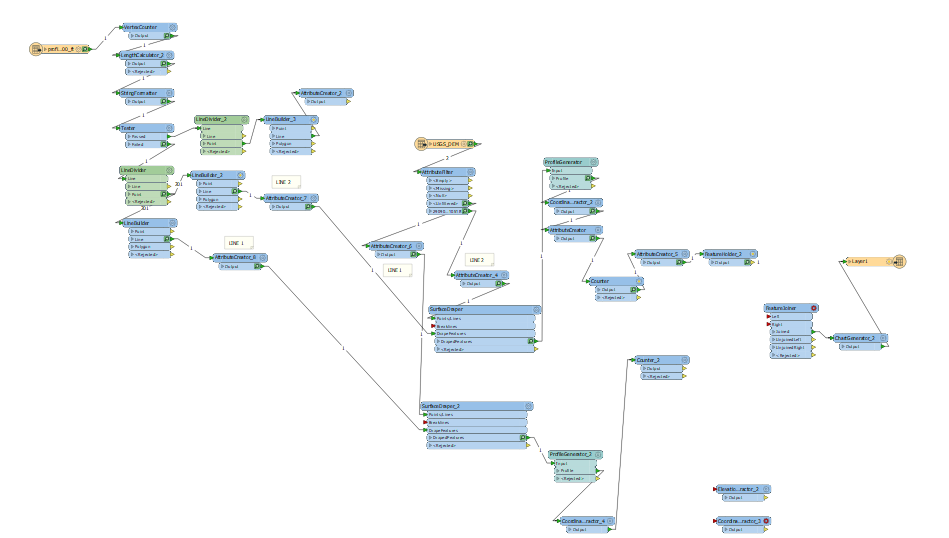
+2
- Safer
- 327 replies
-
13 November 2018
It will not get to the chart generator. Once one DEM goes through the profile generator the second one stops at the profile generator it is linked to and the process finishes..
Hi @tbs_gis_team, It might help the community better understand your problem, if you could attach your workspace (.fmw) the log file generated from the translation (.log), as well as the sample data (if they are different from the previous attachment)
Userlevel 6
+32
- Celebrity
- 2337 replies
-
14 November 2018
Hi @tbs_gis_team, It might help the community better understand your problem, if you could attach your workspace (.fmw) the log file generated from the translation (.log), as well as the sample data (if they are different from the previous attachment)
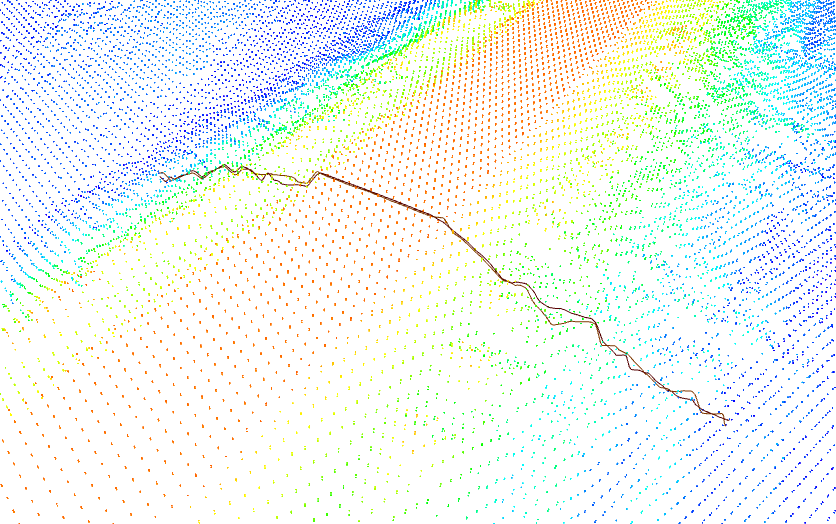
It is hard to reproduce your issue without data and workspace. I could not read the transformer names from your last screenshot either.
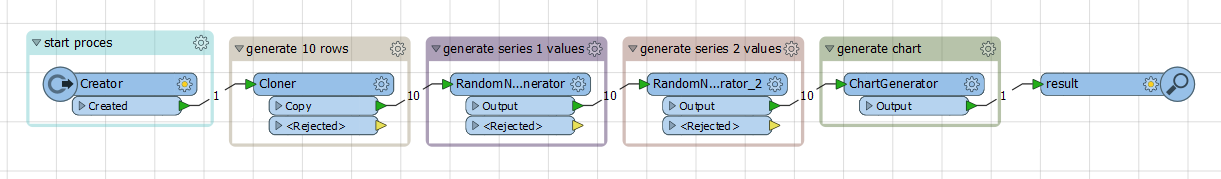
So created a poc from might be what you described. I used pointclouds instead of rasters but the principle is the same.
Edit: uploaded workpace template file with data. profilesfrompointcloud.fmwt
I got it working, Thanks for all the comments...Chad
Reply
Enter your username or e-mail address. We'll send you an e-mail with instructions to reset your password.