Question

Raster Palette Ranges

  • 6 February 2017
  • 7 replies
  • 13 views

Badge

I am trying to create a colour palette for a single band raster, where the cell values range from the -1 to 1. Is it possible to create a colour palette where the resultant RGB colour are referenced to a cell value via a range than the exact matching of a single value?

For example how could the range values and colours listed below be used to visualise a raster?
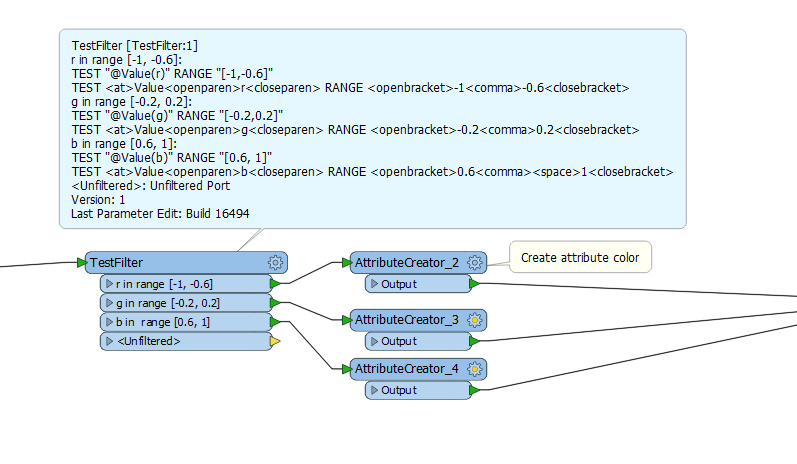
class_range,r,g,b

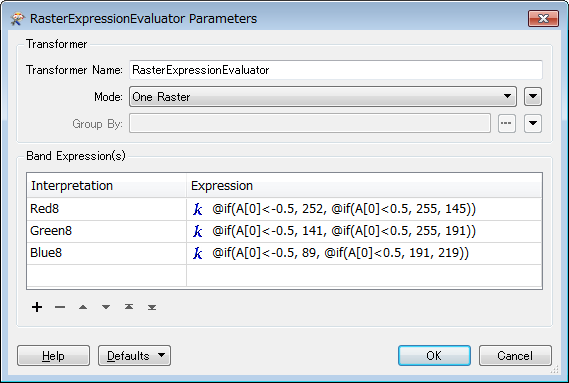
[-1.0]..[-0.6],252,141,89

[-0.2]..[0.2],255,255,191

[0.6]..[1.0],145,191,219

Is this possible? If so can anyone provide some advice?

I am using FME Desktop 2015.1.

Regards,

Rob


7 replies

Badge

Hi @rob14


I think you can solve this issue with a basic TestFilter and some AttributeCreators or combine everything in an AttributeManager with conditional values.


Userlevel 2
Badge +17

Hi @rob14, how many colors do you need to define? If the number of colors is not so large, I would transform the source raster into RGB color raster with the RasterExpressionEvaluator and then generate a palette with the RasterPaletteGenerator.

[Addition] e.g. if you need only three colors:

Badge


Hi @takashi and @jeroenstiers

Thanks you both for the workflows whci you sent, these are the type of thing which I was interested to know. As I was unaware as to the method to create a range clause for a raster value.

At present I do not know the number of classes which I will potemntially require, therefore these alternate methods will provide me with some options.

Regards,

Rob

Userlevel 2
Badge +17

If you have created an external table which defines the mapping rules between value ranges and palette entries, e.g. "resource.csv":

lower,upper,entry,R,G,B
-1.0,-0.6,0,100,240,240
-0.6,-0.2,1,140,180,220
-0.2,0.2,2,180,100,180
0.2,0.6,3,220,180,140
0.6,1.1,4,240,240,100

this workflow might work for you.

0684Q00000ArLbkQAF.png

0684Q00000ArLZkQAN.png

SQL Query:

select a.*, b.entry
from raster as a inner join resource as b
on b.lower <= a.value and a.value < b.upper

Palette: the transformers within the lower bookmark create this text as an attribute called '_palette'.

RGB24
0 100,240,240
1 140,180,220
2 180,100,180
3 220,180,140
4 240,240,100

Regarding palette definition, see the help doc on the RasterPaletteExtractor transformer.

Hope this helps.

Badge

Hi @takashi

Thanks for the revised workflow, I am sure that I will need to implement more that 2 or 3 ranges. Therefore your new workflow will provide greater flexibility. I am in the process of working on the stages before the visualisation. I will let you know how I get on with the visualisation element.

Regards,

Rob

Userlevel 2
Badge +17

Reminded me a similar question. This Q&A; could also be a hint.

Classify raster data by breakpoints

Badge

Reminded me a similar question. This Q&A; could also be a hint.

Classify raster data by breakpoints

Hi @takashi,


Thanks for the additional link to the breakpoints post.


This is another interesting way to achieve the visualisation, and exactly what I was after.


I spent some time last night working on and understanding the nested if statements, and have devised my breakpoints (about 12). I used a graduation of only r values (0-225) to visualise but having seen this other example I think that the 'reclassing' example with additional palette creation will allow of greater visual clarity.


In addition/out of interest; I presume that you could also use this technique to actually reclass a raster using user defined ranges if you wanted to? And then subsequently split out into the revised classes? I only ask as I have a floating point raster which I am going to have to do this for i.e. something similar to NDVI splitting.


Regards,


Rob


Reply